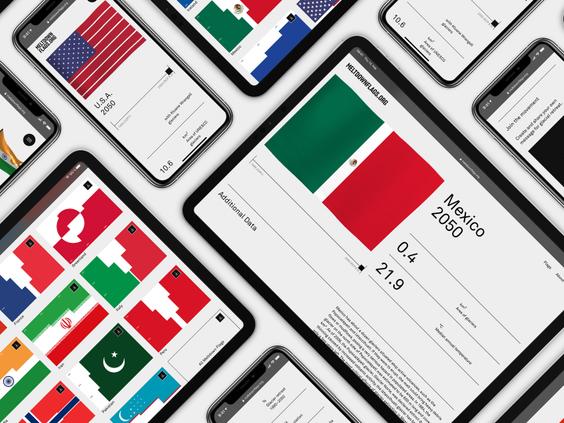
Meltdown Flags is a climate data initiative that visualizes the effects of global glacier retreat by reducing the amount of white in the flags of countries with glaciers.
Glaciers are a source of life—they provide vital drinking water, help generate power for millions of homes, and are our most valuable indicators in understanding the future of global climate change. Without glaciers we would live in a very different world. Complete meltdown would bring sea level rise to a record high, and eliminate 69% of the world’s drinking water. Although not every country may have a glacier, every country depends on their survival.

Freedom Grams Title
Lorem Ipsum is simply dummy text of the printing and typesetting industry.
Copyright

Meltdown Flags CAN
Lorem ipsum dolor sit amet, consectetuer adipiscing elit. Aenean commodo ligula eget dolor. Aenean massa. Cum sociis natoque penatibus et magnis dis parturient montes.
STD.DEV

Meltdown Flags USA

Meltdown Flags Exhibition Production
The goal of this project is to educate about the importance of glaciers, provide solutions to reduce emissions and put pressure on politics to deal with the climate crisis. Meltdown Flags is an open source climate data project initiated by environmental technology company METER. Data sources include METER, UNESCO, NASA, World Glacier Monitoring System (WGMS), United Nations Environmental Programme, the University of Zurich and the University of Innsbruck.
Handsewn flags take the message to the streets. In December 2019, Meltdown Flags made their first appearance at the COP25 in Madrid. Since then, they have become a symbol of protest at climate demonstrations and events around the world.


A website provides more information and ways to act. Visitors can visualize the degree of glacier retreat by country, as well as access more data and information. They can also calculate and offset their carbon footprint. By downloading the flags and custom typeface, they also take part in the initiative.

An interactive exhibition concept adds another dimension. Lenticular installations of the Meltdown Flags help visualize the glacier retreat depending on the position of the viewer. An Instagram AR filter activated by the flags allows visitors and app users alike to immerse themselves in the data.
Meltdown Flags show the past, current and future state of meltdown. Created custom typeface visualise this accelerated melt process through three developed cuts. Starting from 1995, the year of the first United Nations Climate Change Conference, to 2050, the year set out by the UN to reach net-zero emissions and limit global temperature to 1.5 °C.