Projects
Meltdown Flags
Procedural GPU Shaders & Spatial AR
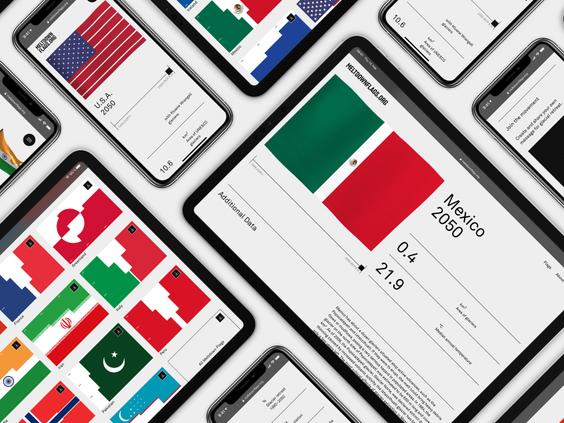
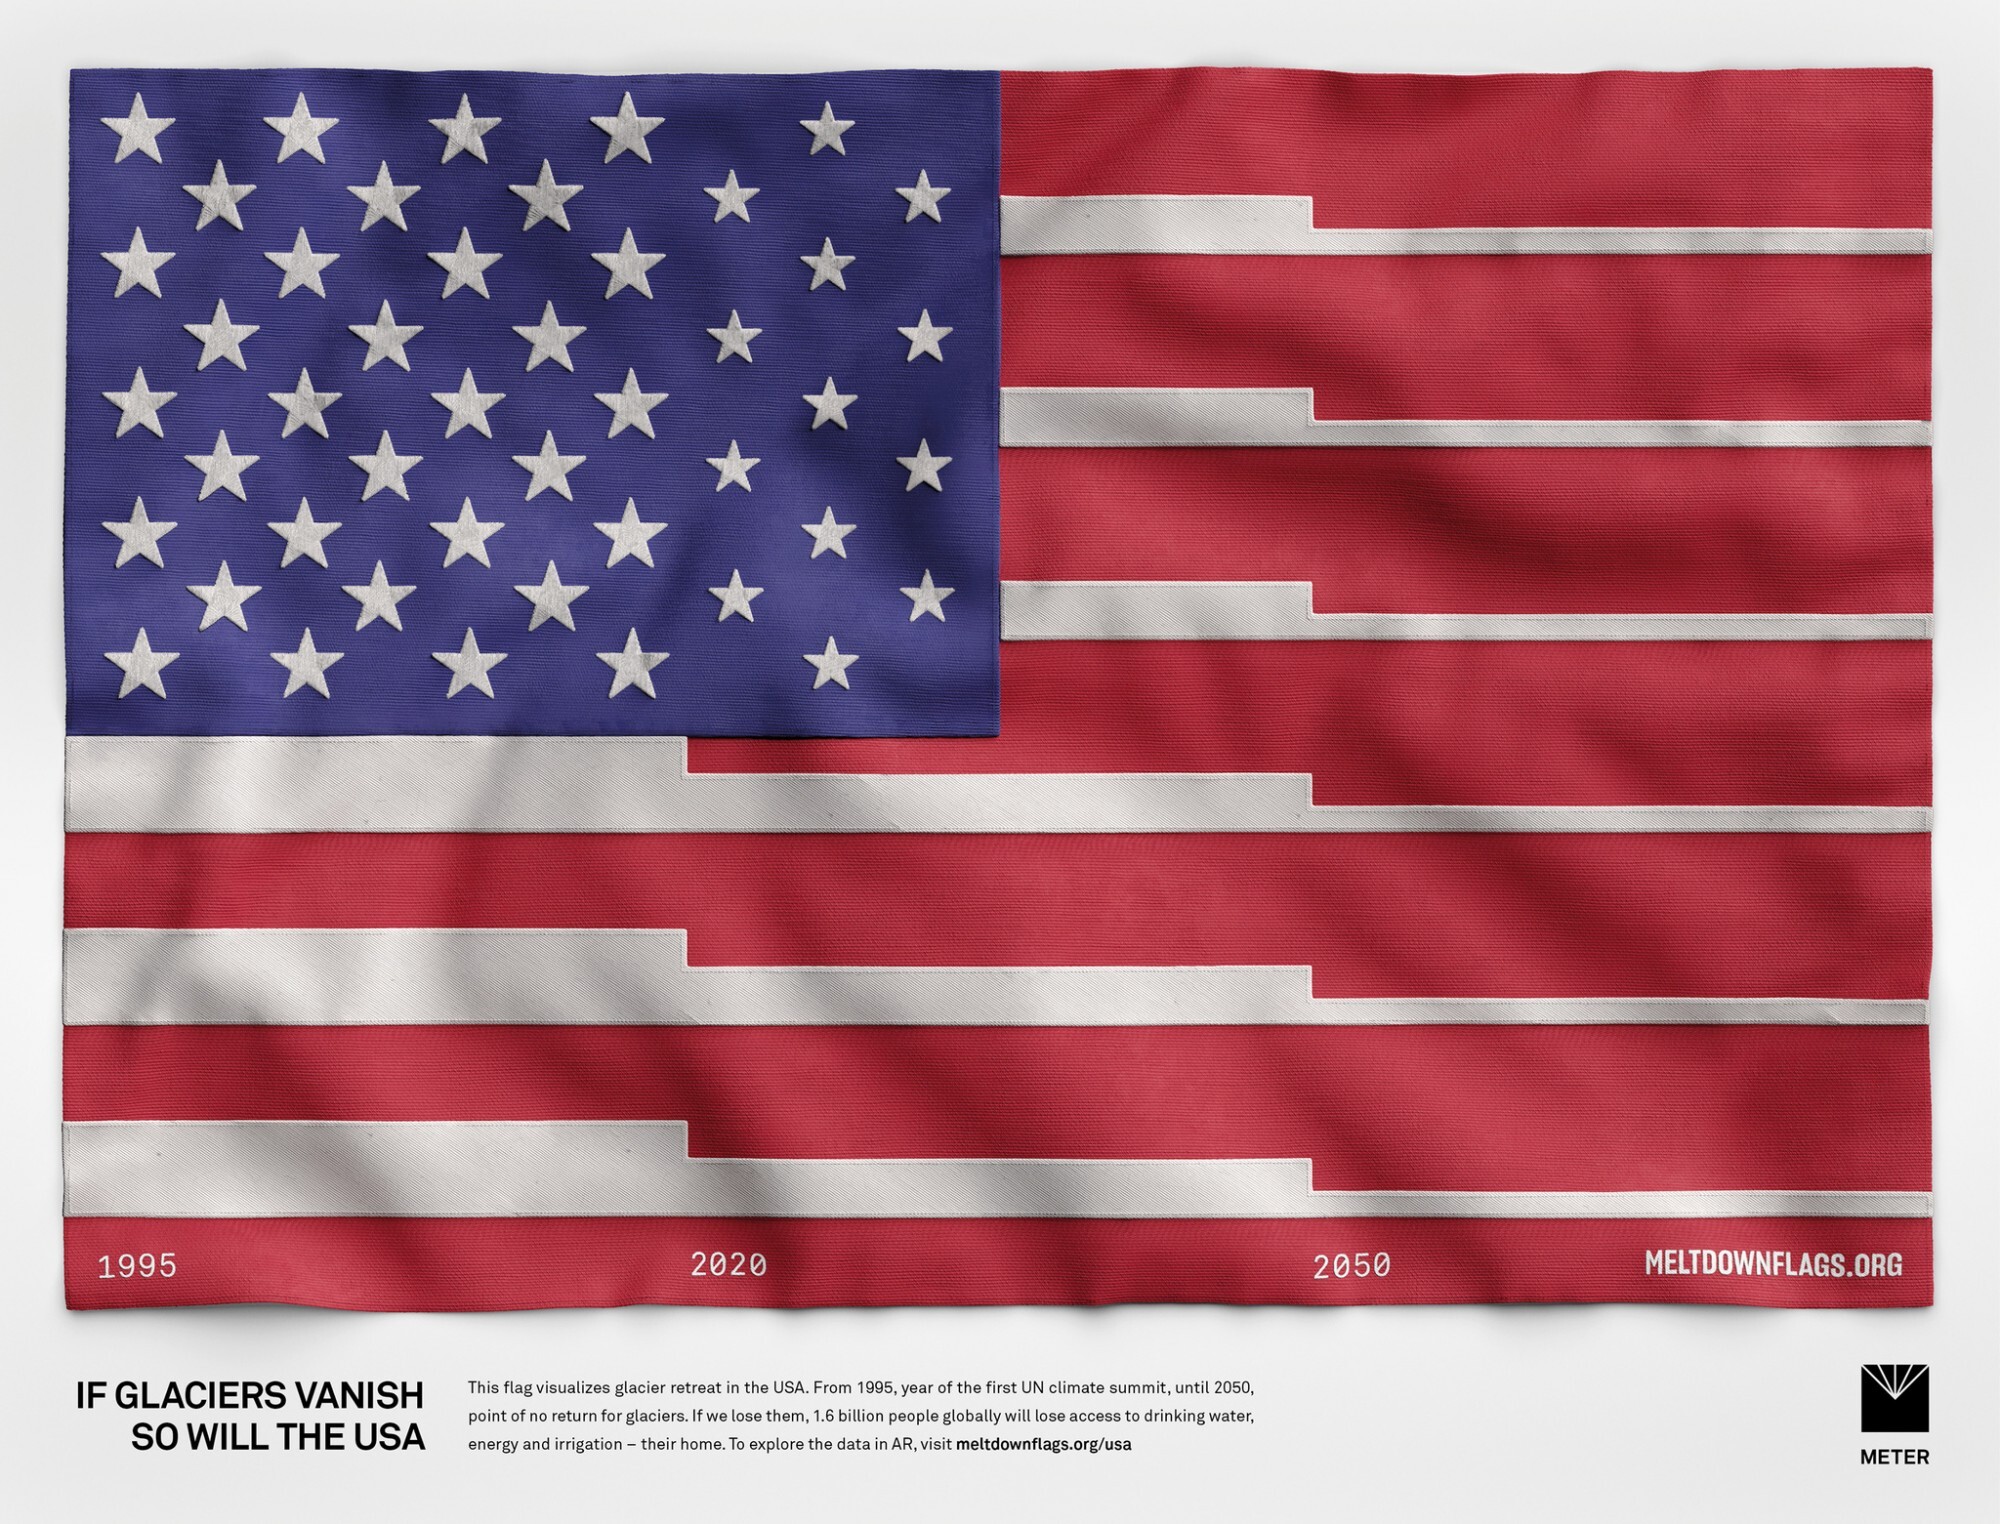
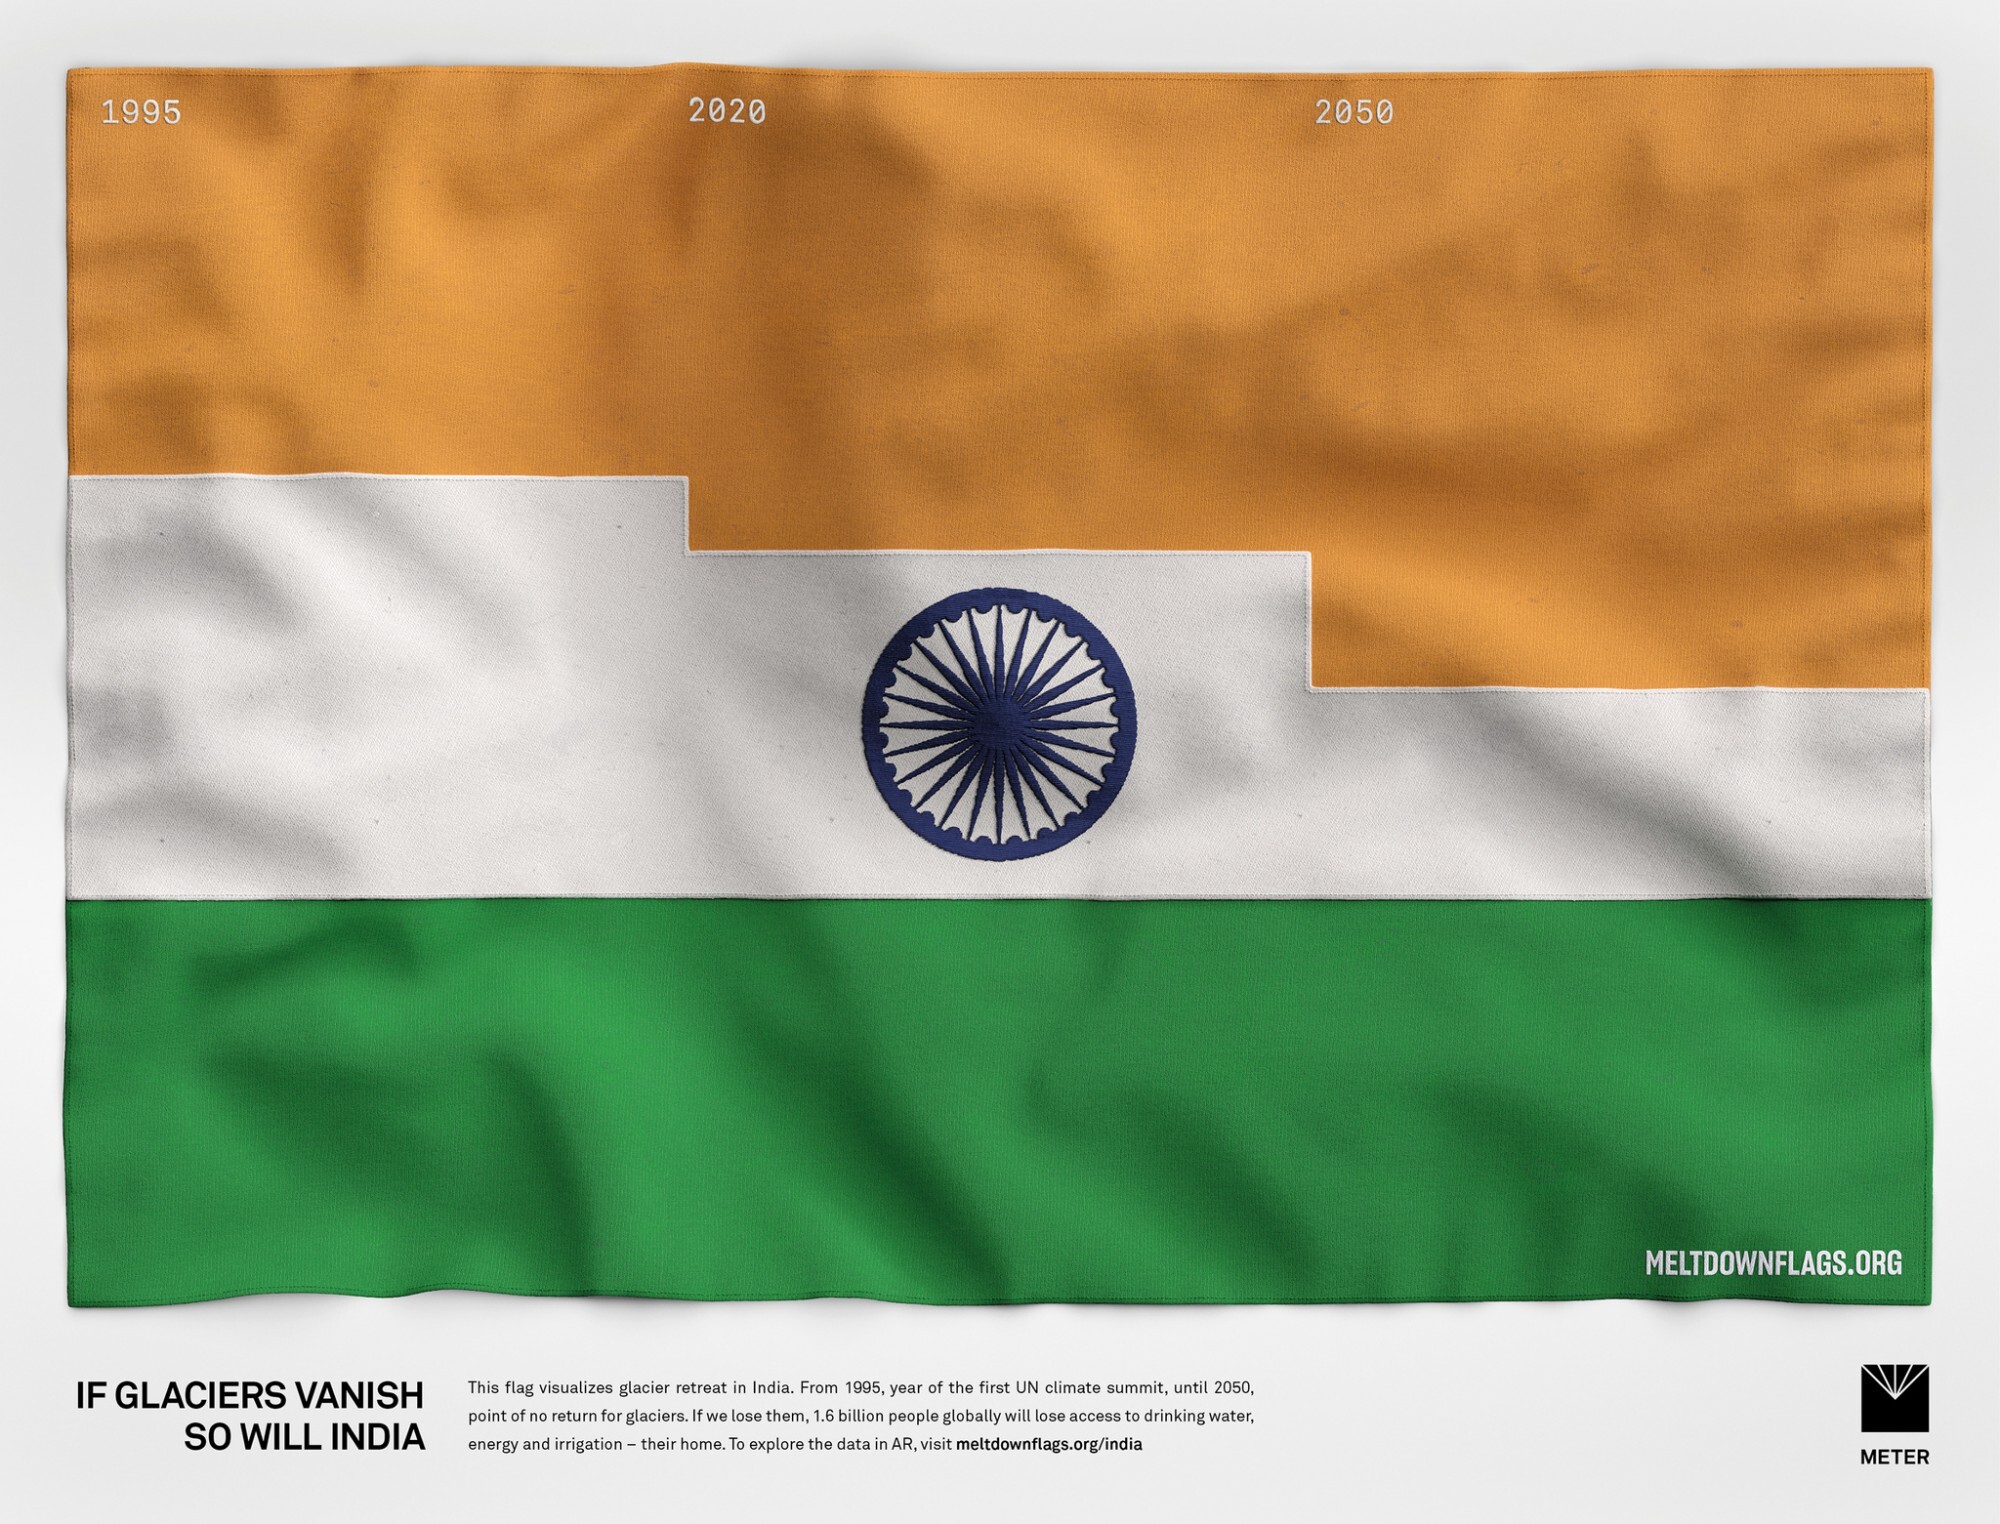
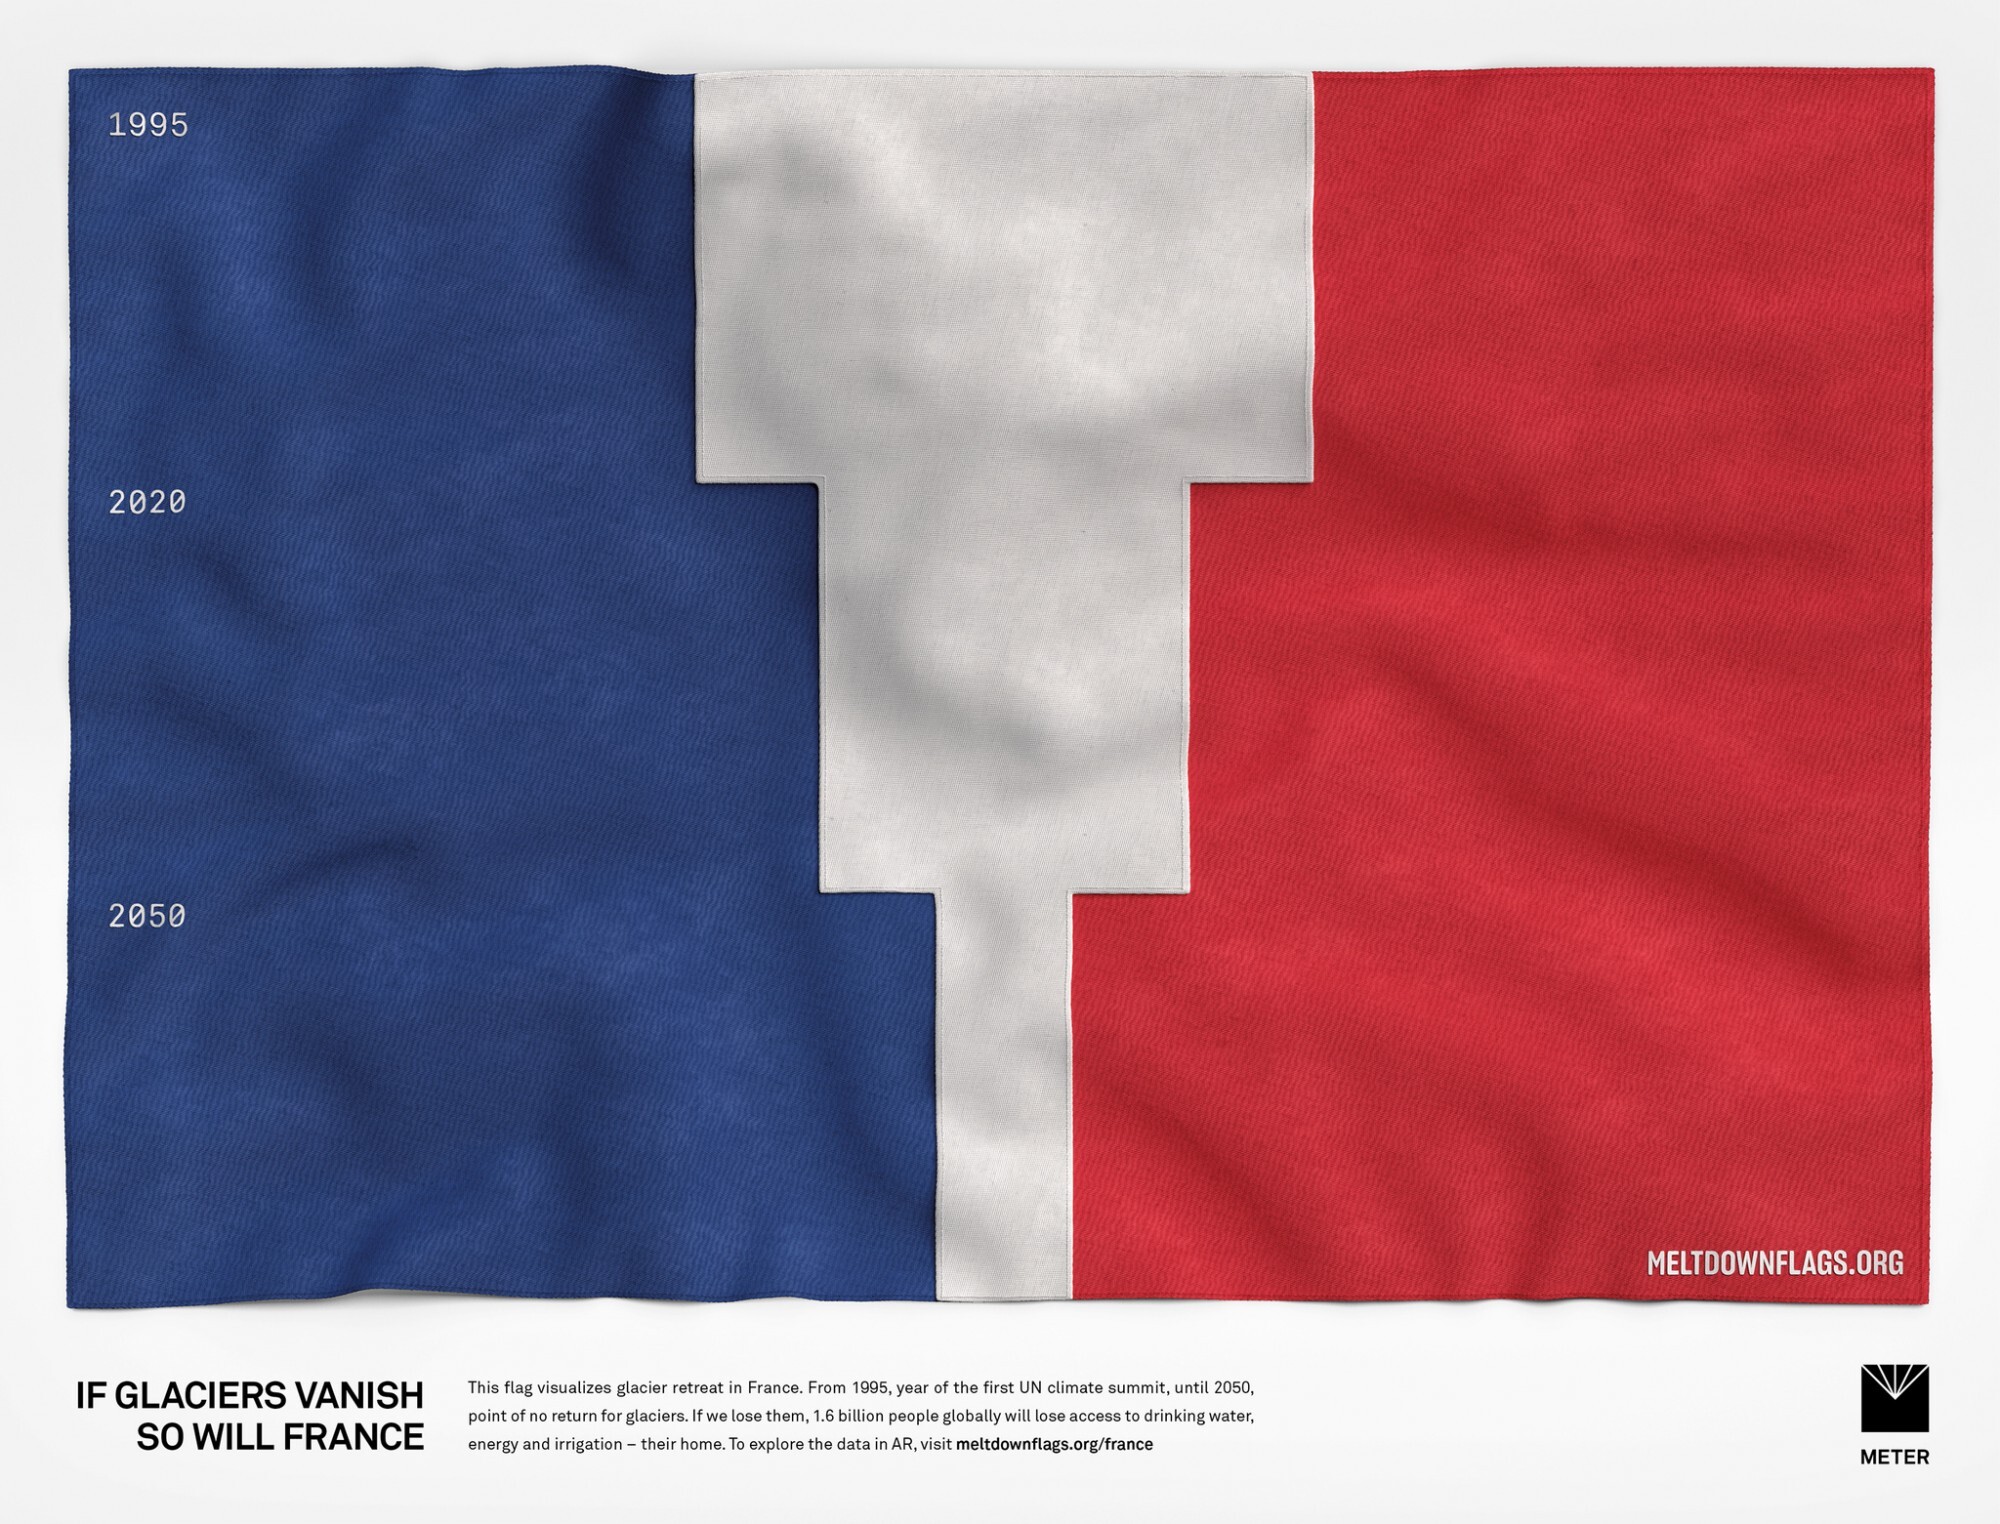
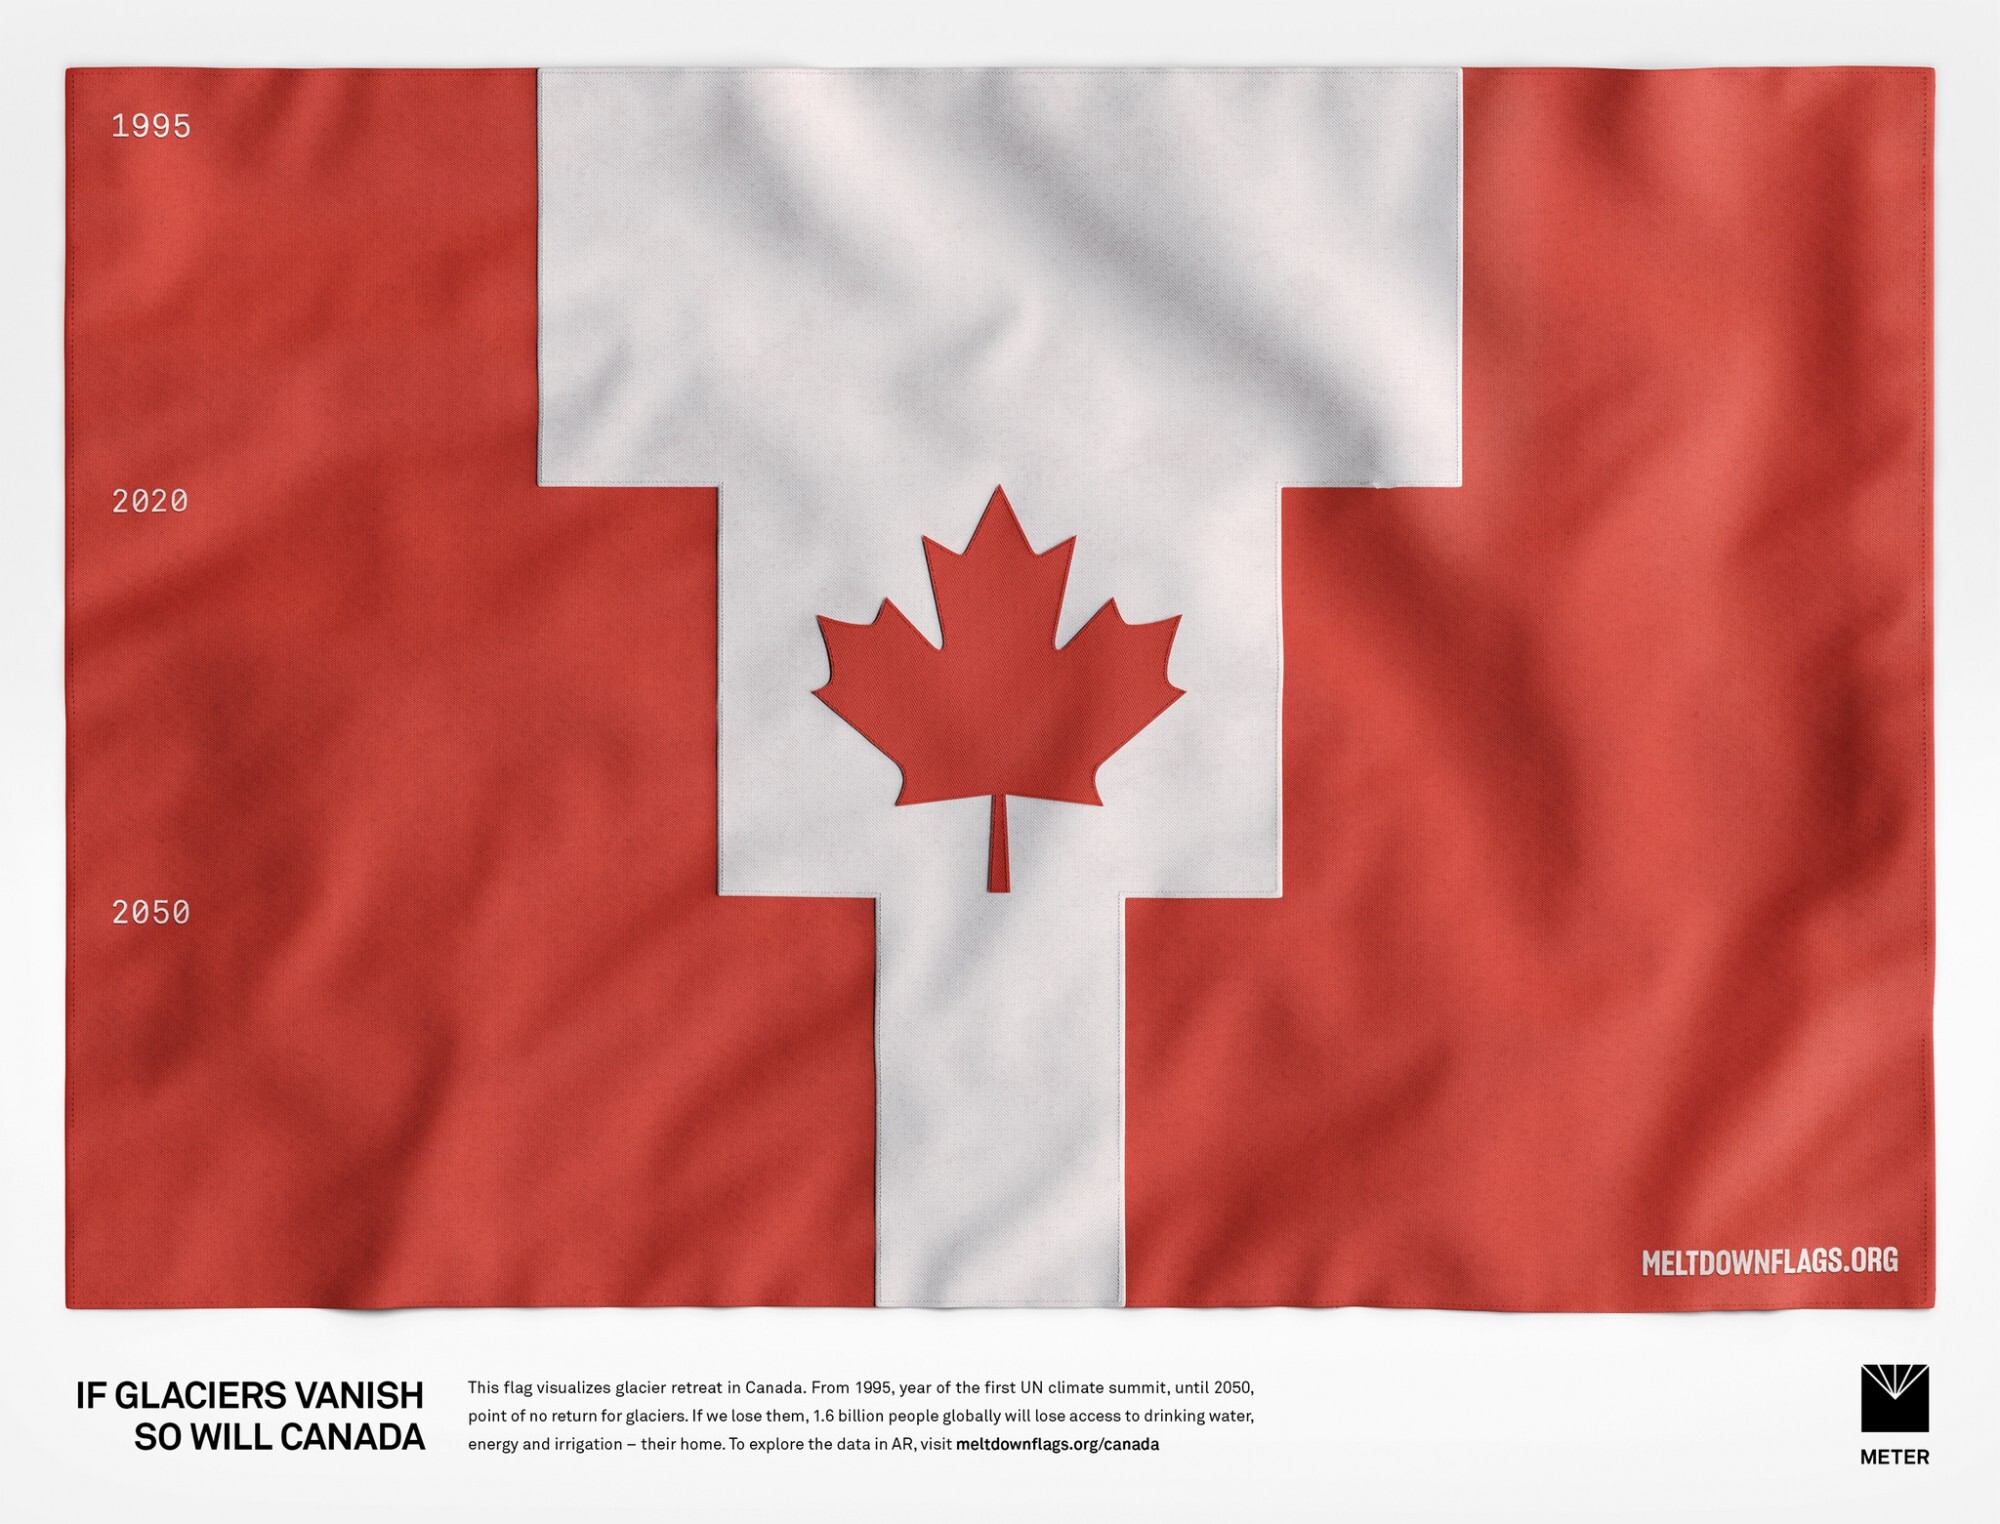
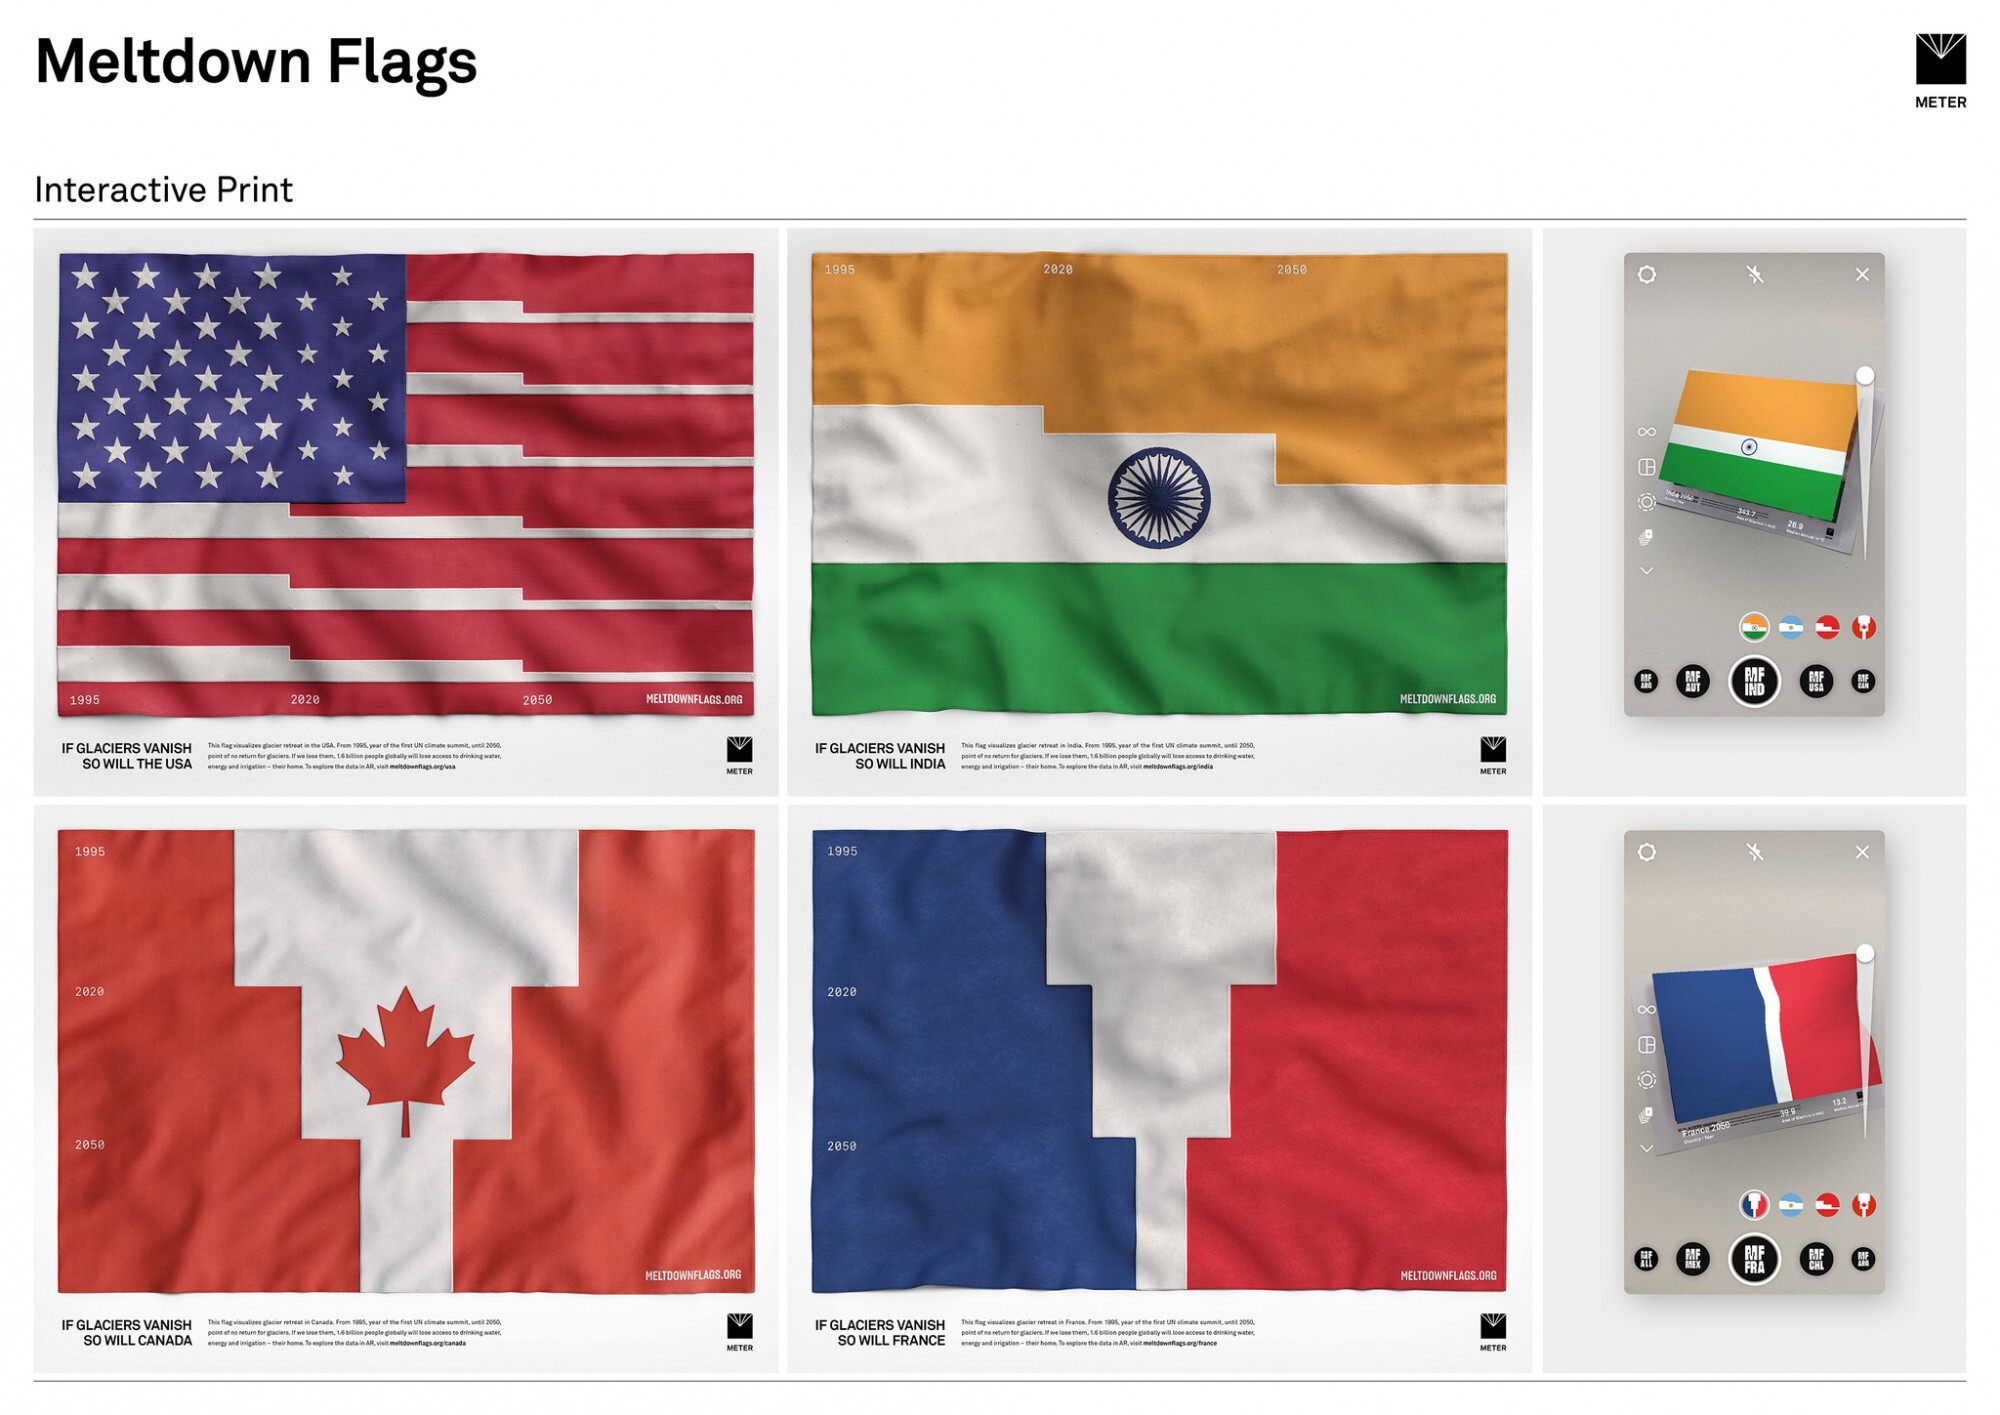
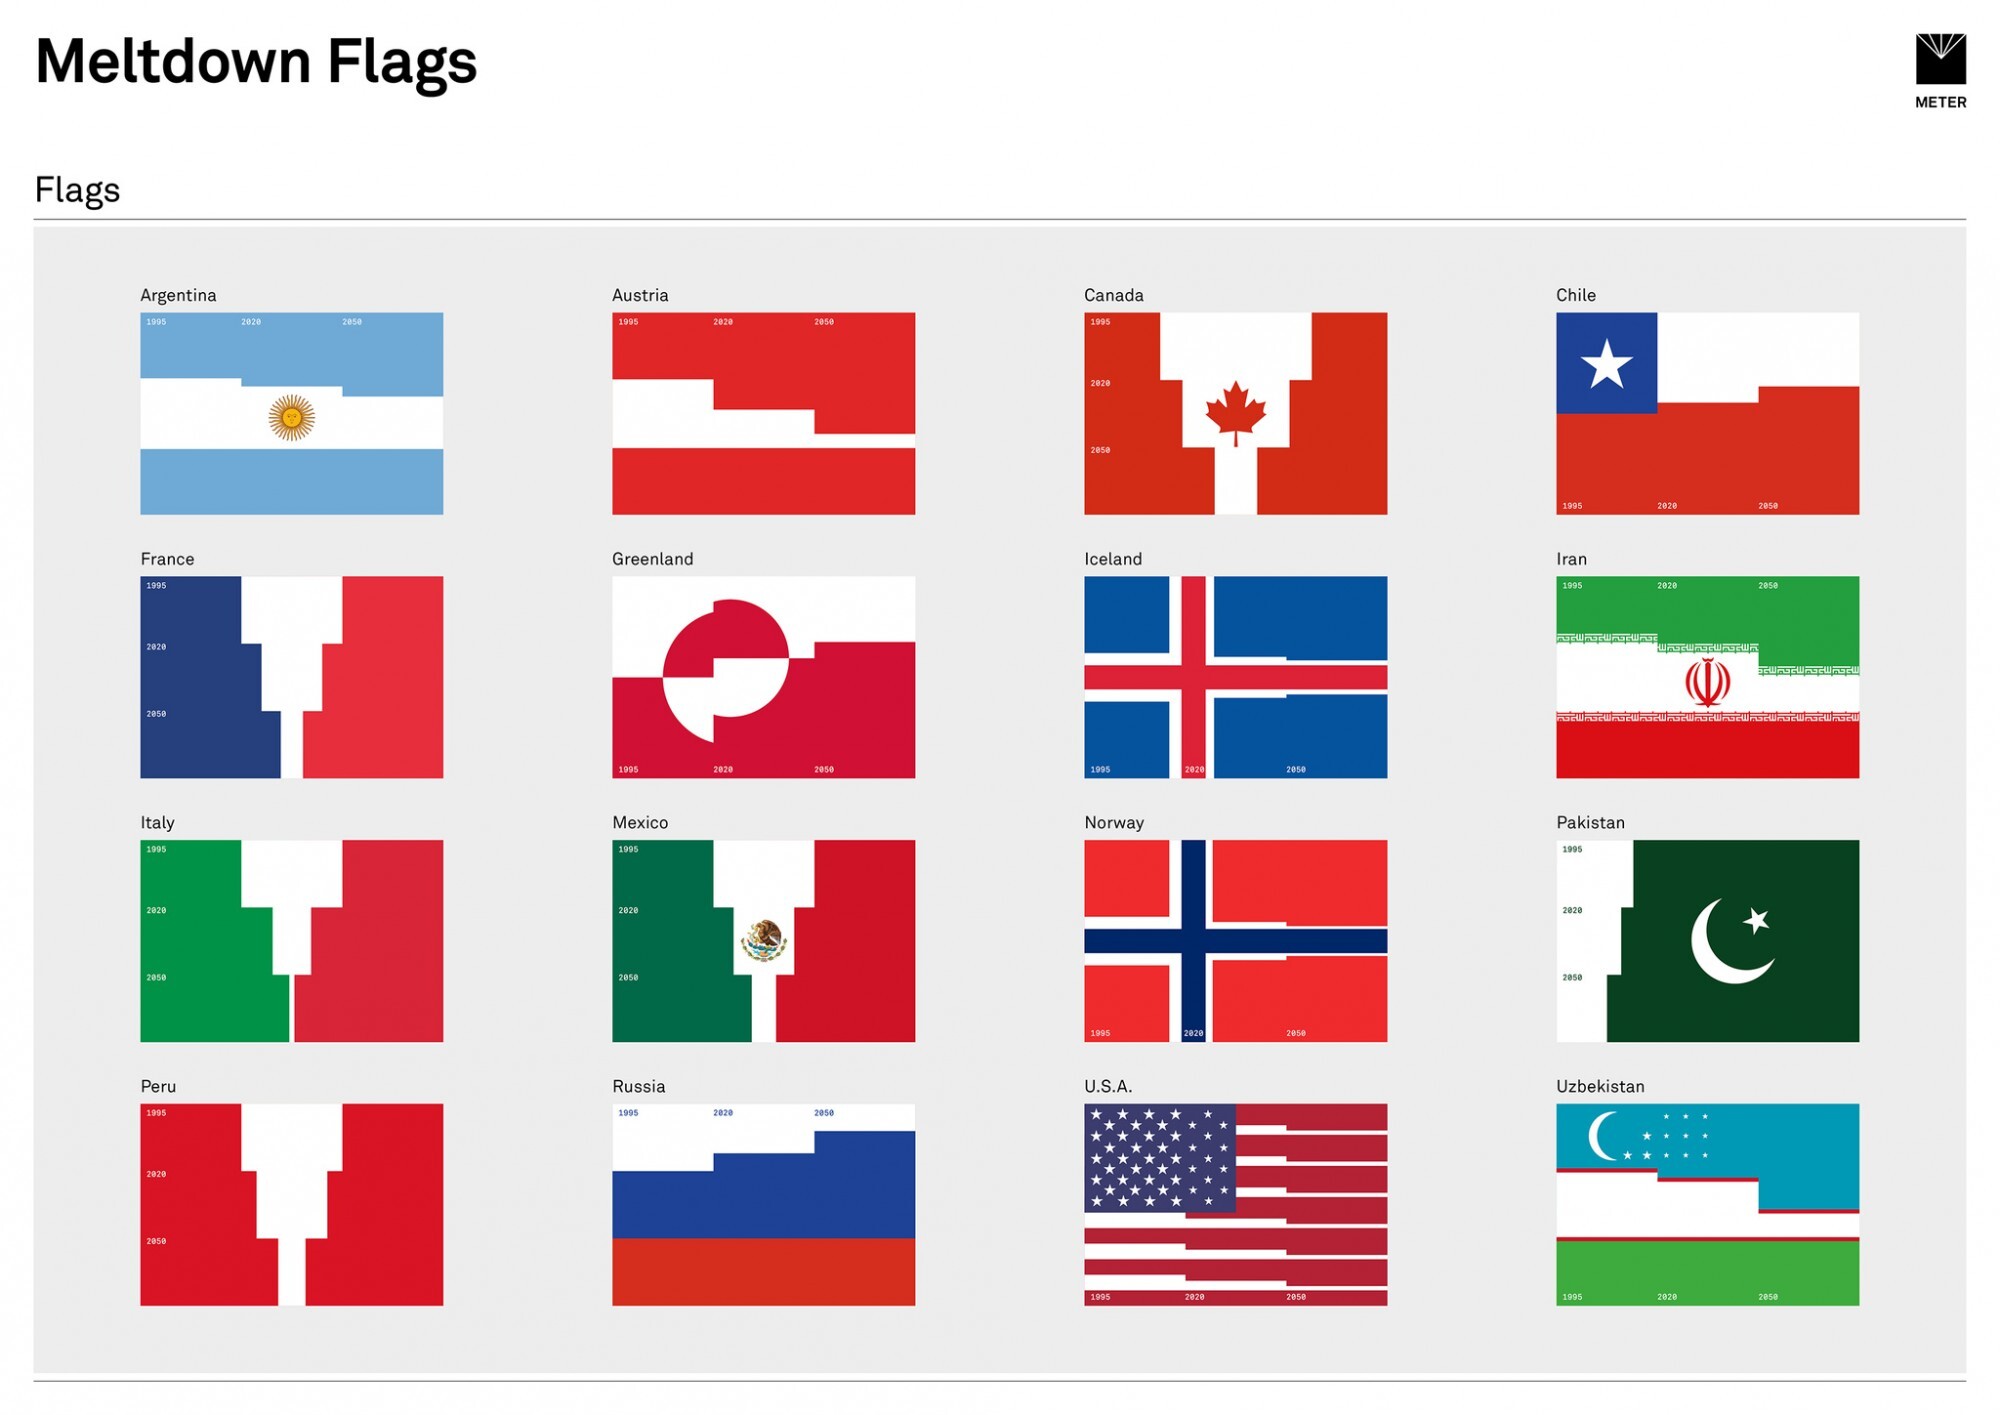
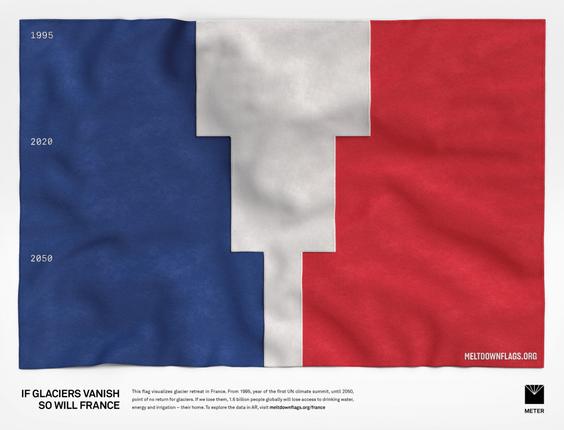
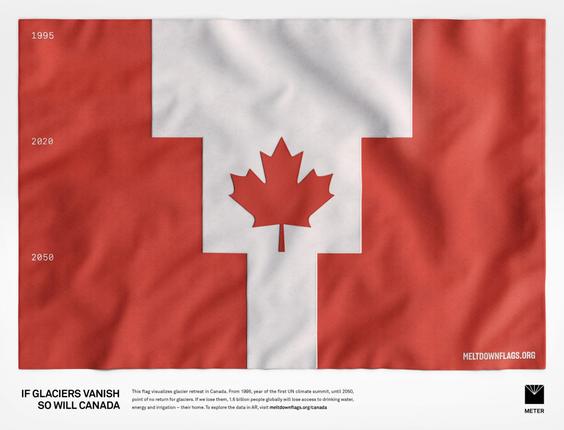
Meltdown Flags is a global climate data initiative that visualizes the acceleration of glacier retreat by dynamically reducing the proportion of white in the flags of countries with glaciers. Glaciers are a source of life—they provide vital drinking water, help generate power for millions of homes, and serve as critical indicators for understanding the future of global climate change. Complete meltdown would trigger record sea-level rise and eliminate 69% of the world’s drinking water. Although not every country has a glacier, every country depends on their survival.
For METER Group, a global leader in environmental sensor technology measuring the soil-plant-atmosphere continuum, the challenge was turning complex, abstract glaciological datasets into an immediate, emotional call to action. METER needed a medium that could make invisible environmental data visible on a global scale.
The Technical Roadblock
The campaign’s global distribution hinged entirely on solving a severe technical bottleneck. Earlier prototypes attempted to render animated 3D flags using pre-rendered texture sequences and static meshes. This resulted in heavy asset bloat and low frame rates that violated strict Instagram AR filter payload restrictions and choked mobile web browsers, stalling the project.
The Solution
Commissioned by Serviceplan Innovation, STD.DEV was brought in to rebuild the core interactive technology from scratch. Daniel Kuhnlein discarded the legacy pipeline entirely, replacing heavy pre-baked media with a custom procedural GPU shader architecture. By translating flag geometries, 3D cloth physics, and historical glacier retreat data (1995, Present Day, 2050) directly into pure mathematical algorithms, he unlocked full creative expression without the performance cost.
Impact
This zero-texture-sequence architecture enabled fluid 60fps performance across AR-enabled outdoor posters, museum terminals, and web platforms. By reducing payload size to mere kilobytes, the underlying code powered the campaign’s presence at the UN Climate Summit (COP25) in Madrid and drove over 80 major global accolades—dominating interactive design, digital craft, and creative technology categories across Cannes Lions, Red Dot, iF Design, D&AD, and the ADC Germany Grand Prix.
Meltdown Flags demonstrates how creative coding and procedural shader math can turn complex environmental metrics into a visceral, perceptual experience. By mapping glaciological data directly to real-time visual feedback, the initiative emotionalizes scientific reality without distorting data precision. Instead of relying on massive video files or image sequences, the shrinking white areas of the flags are calculated and drawn in real-time by the device's graphics processor, completely eliminating file bloat. To ensure a highly scalable foundation for the project, STD.DEV delivered this technology across three core components:
1. Spatial AR Application
Compiling the procedural shader logic into lightweight Instagram AR filters, overcoming strict platform payload budgets to run fluidly at 60fps on mobile devices for Instagram and educational classroom tools.
2. Portable Web Components
Crafting modular web components for each national flag that were seamlessly embedded into the campaign website. Flag proportions and retreat states were exposed via HTML attributes, enabling dynamic, real-time control through external UI sliders.
3. Campaign Media Export Suite
Building a custom browser-based rendering tool that enabled creative teams to export high-resolution 24-bit PNG images and seamlessly looped video sequences of the flags on demand for print collateral, outdoor posters, and social campaigns.
The project proves that technical architecture is not merely an implementation detail—it is the foundation of creative capability. By using code to bypass platform constraints, STD.DEV gave environmental data a scalable structure, enabling a seamless multi-medium deployment that turned sensor metrics into a resonant expression of climate urgency.
Credits
Client
METER Group / METER Environment
Commissioned by & Creative Direction
Serviceplan Innovation / Serviceplan Group
Core Shader Architecture, Spatial AR & Procedural Visualization Engine
STD.DEV
Campaign Website & Platform Integration
Moby Digg
Hyperinteractive
How does Meltdown Flags visualize glacier retreat?
Meltdown Flags visualizes glacier retreat by dynamically reducing the proportion of white in the flags of countries that have glaciers.
What is the significance of glaciers according to the Meltdown Flags initiative?
What would be the consequences of complete glacier meltdown?
What was the primary technical challenge faced by the Meltdown Flags campaign?
How did STD.DEV overcome the technical limitations of the Meltdown Flags project?
What are the three core components of the technology delivered for Meltdown Flags?
How does the Meltdown Flags initiative aim to impact its audience?
What is the strategic advantage of using a zero-texture-sequence architecture in Meltdown Flags?
How does Meltdown Flags ensure data precision while emotionalizing scientific data?
Why is the technical architecture considered foundational to creative capability in Meltdown Flags?
What approach does the Art Directors Club Germany Jury commend in Meltdown Flags?
What makes the Red Dot Design Award Jury consider the Meltdown Flags infographic posters captivating?
How does the Meltdown Flags website succeed in emotionalizing scientific data, according to the iF Design Gold Jury?