Projects
The Period Uniform
Campaign Platform & Technical Architecture
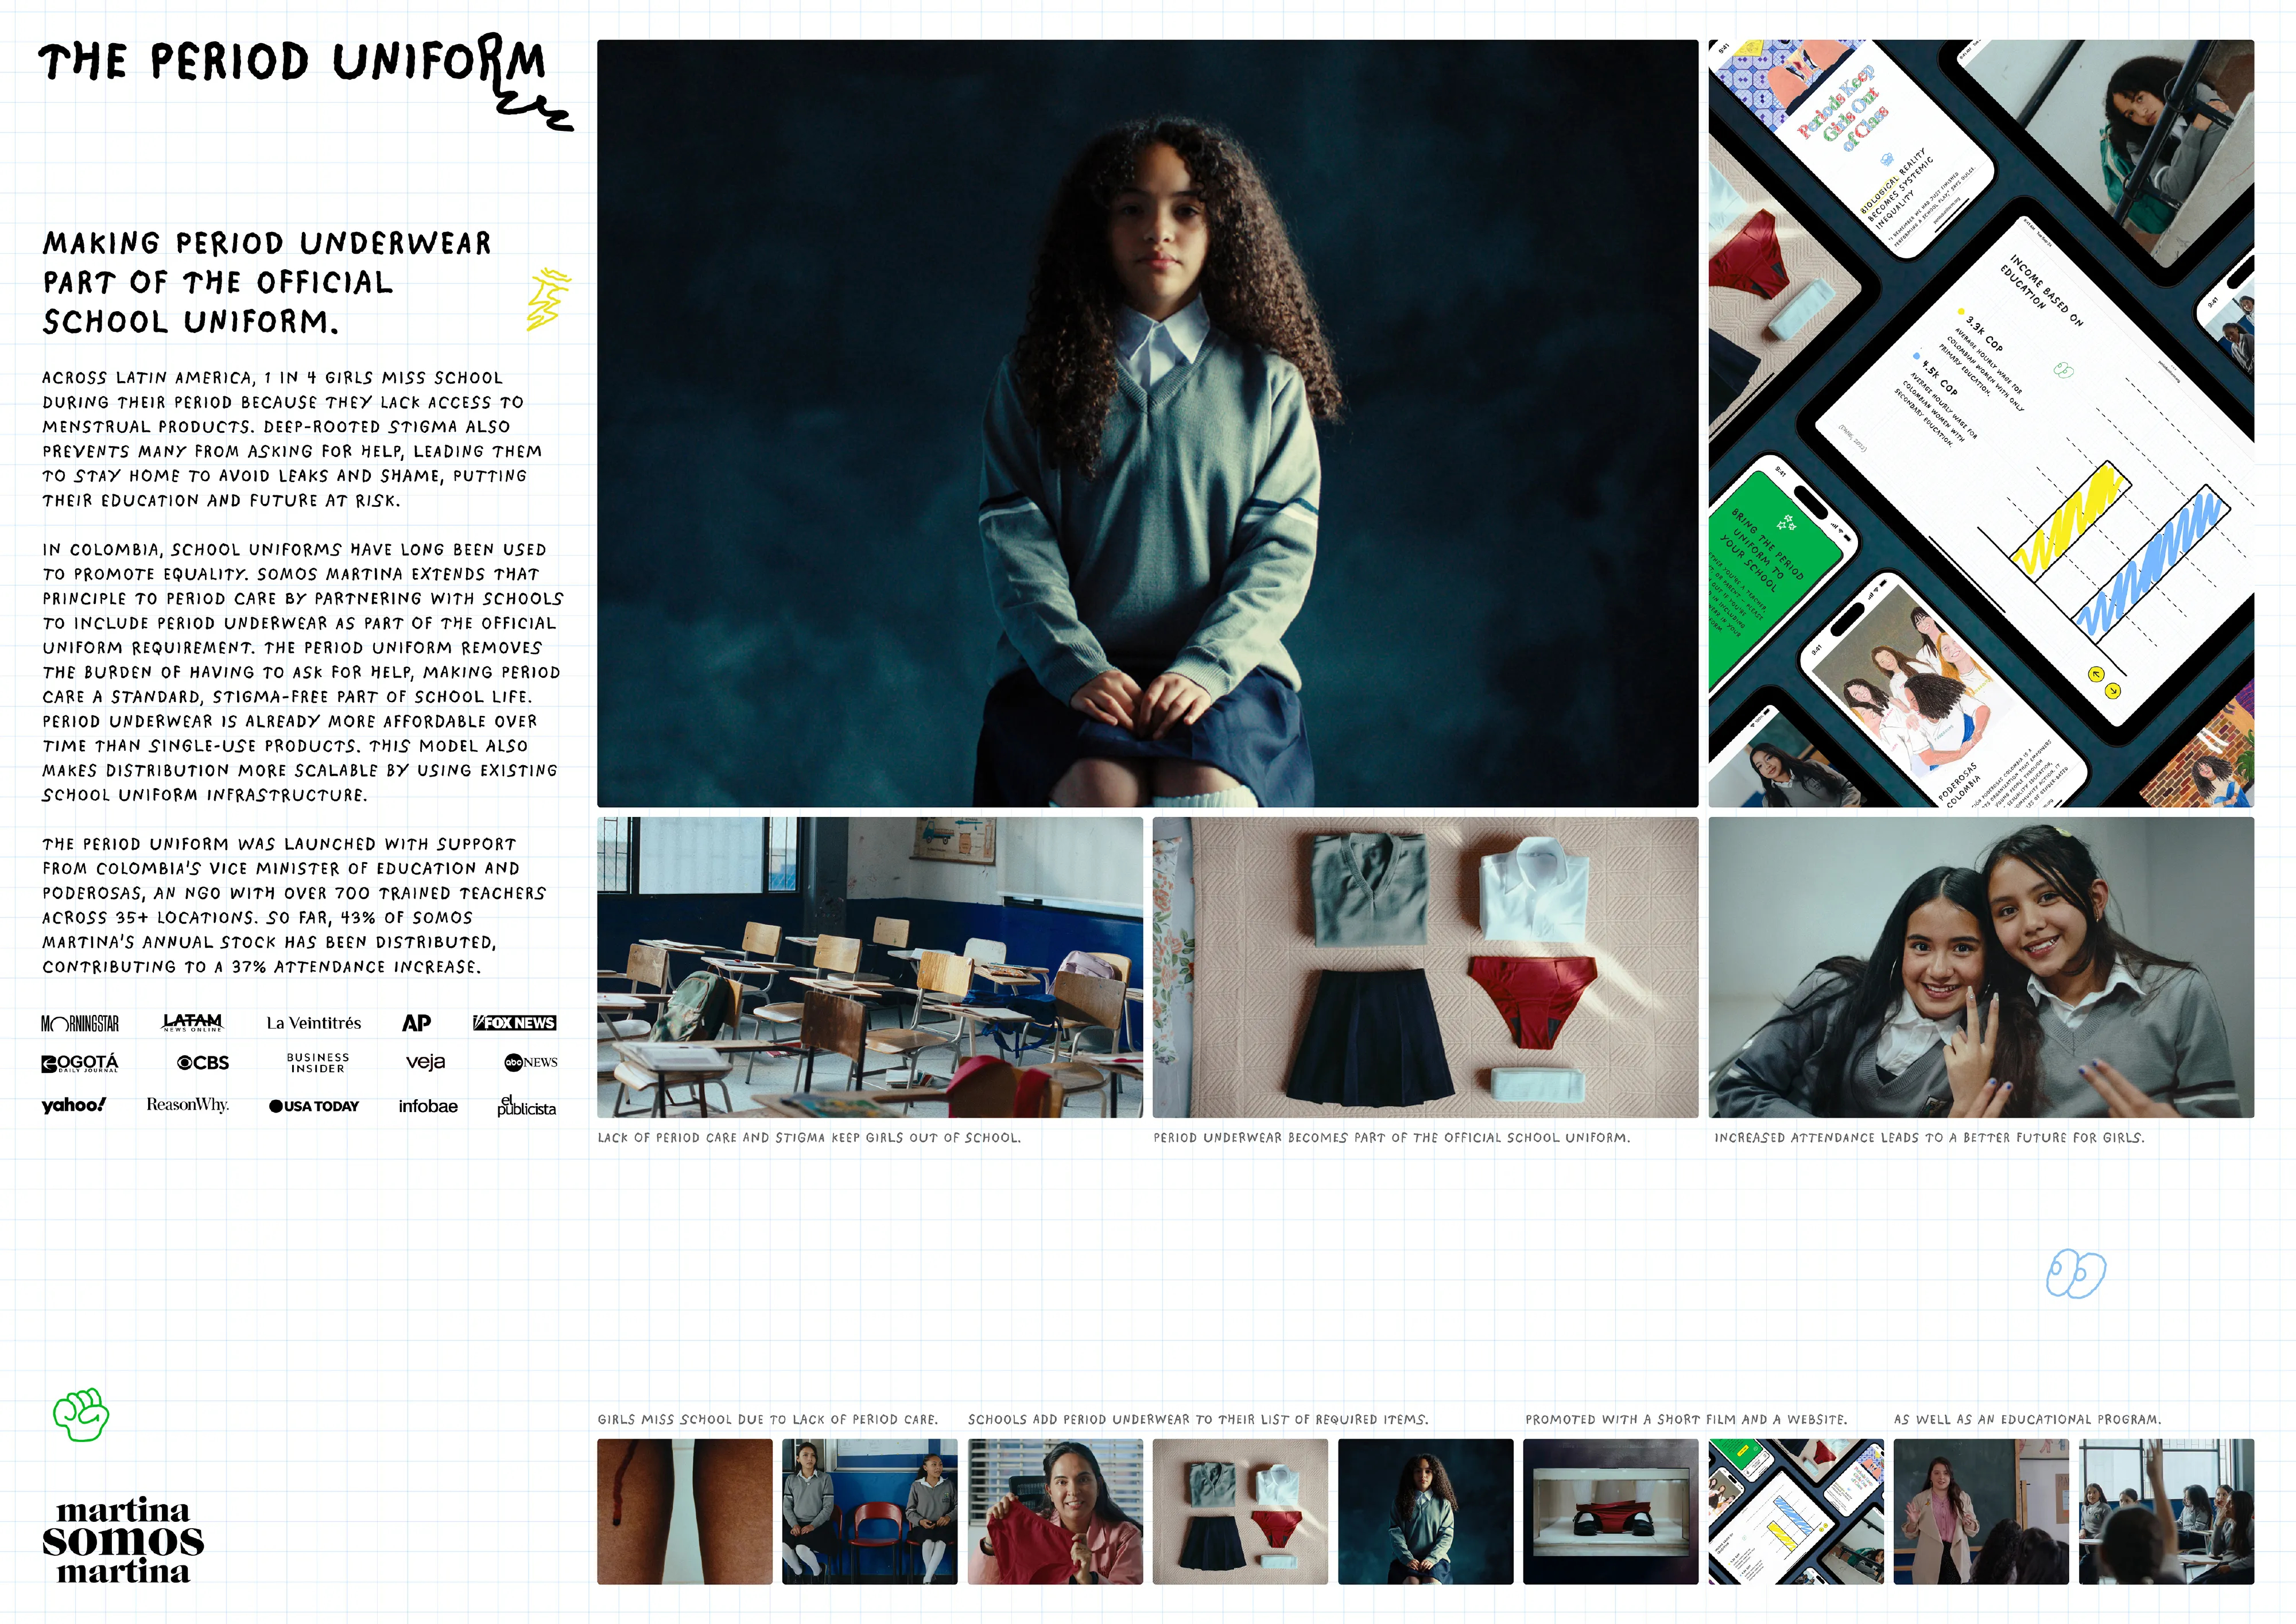
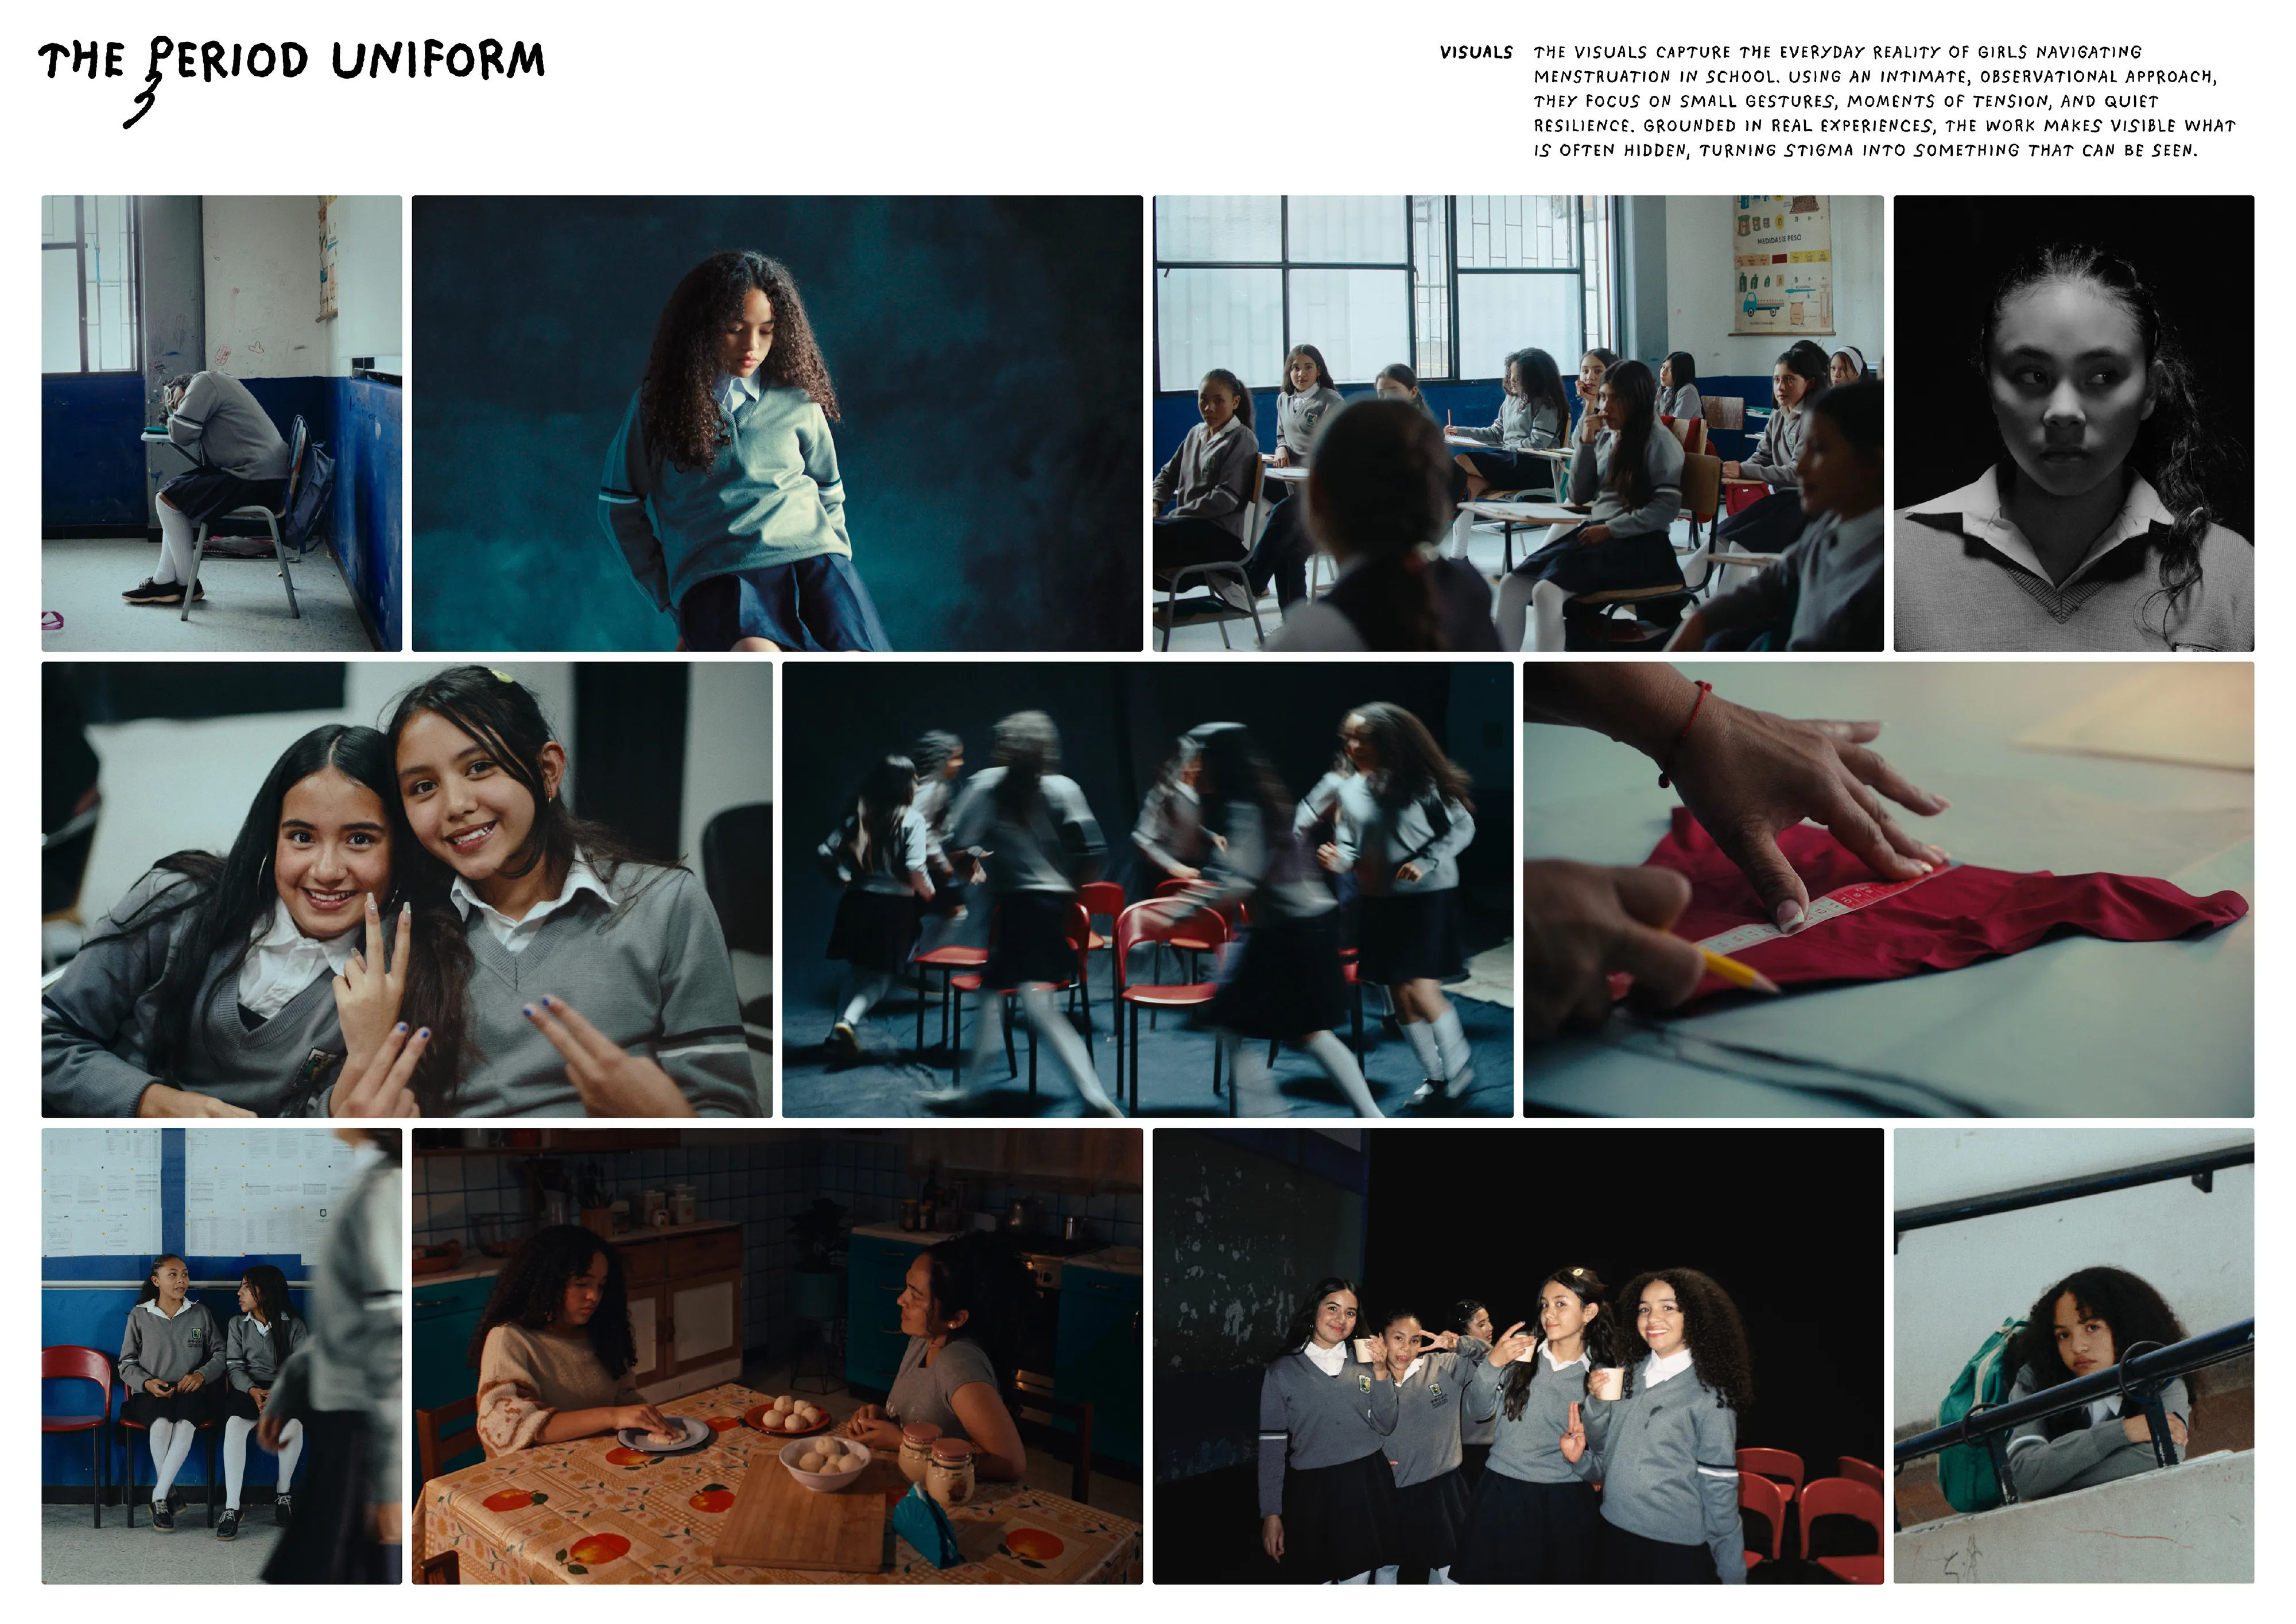
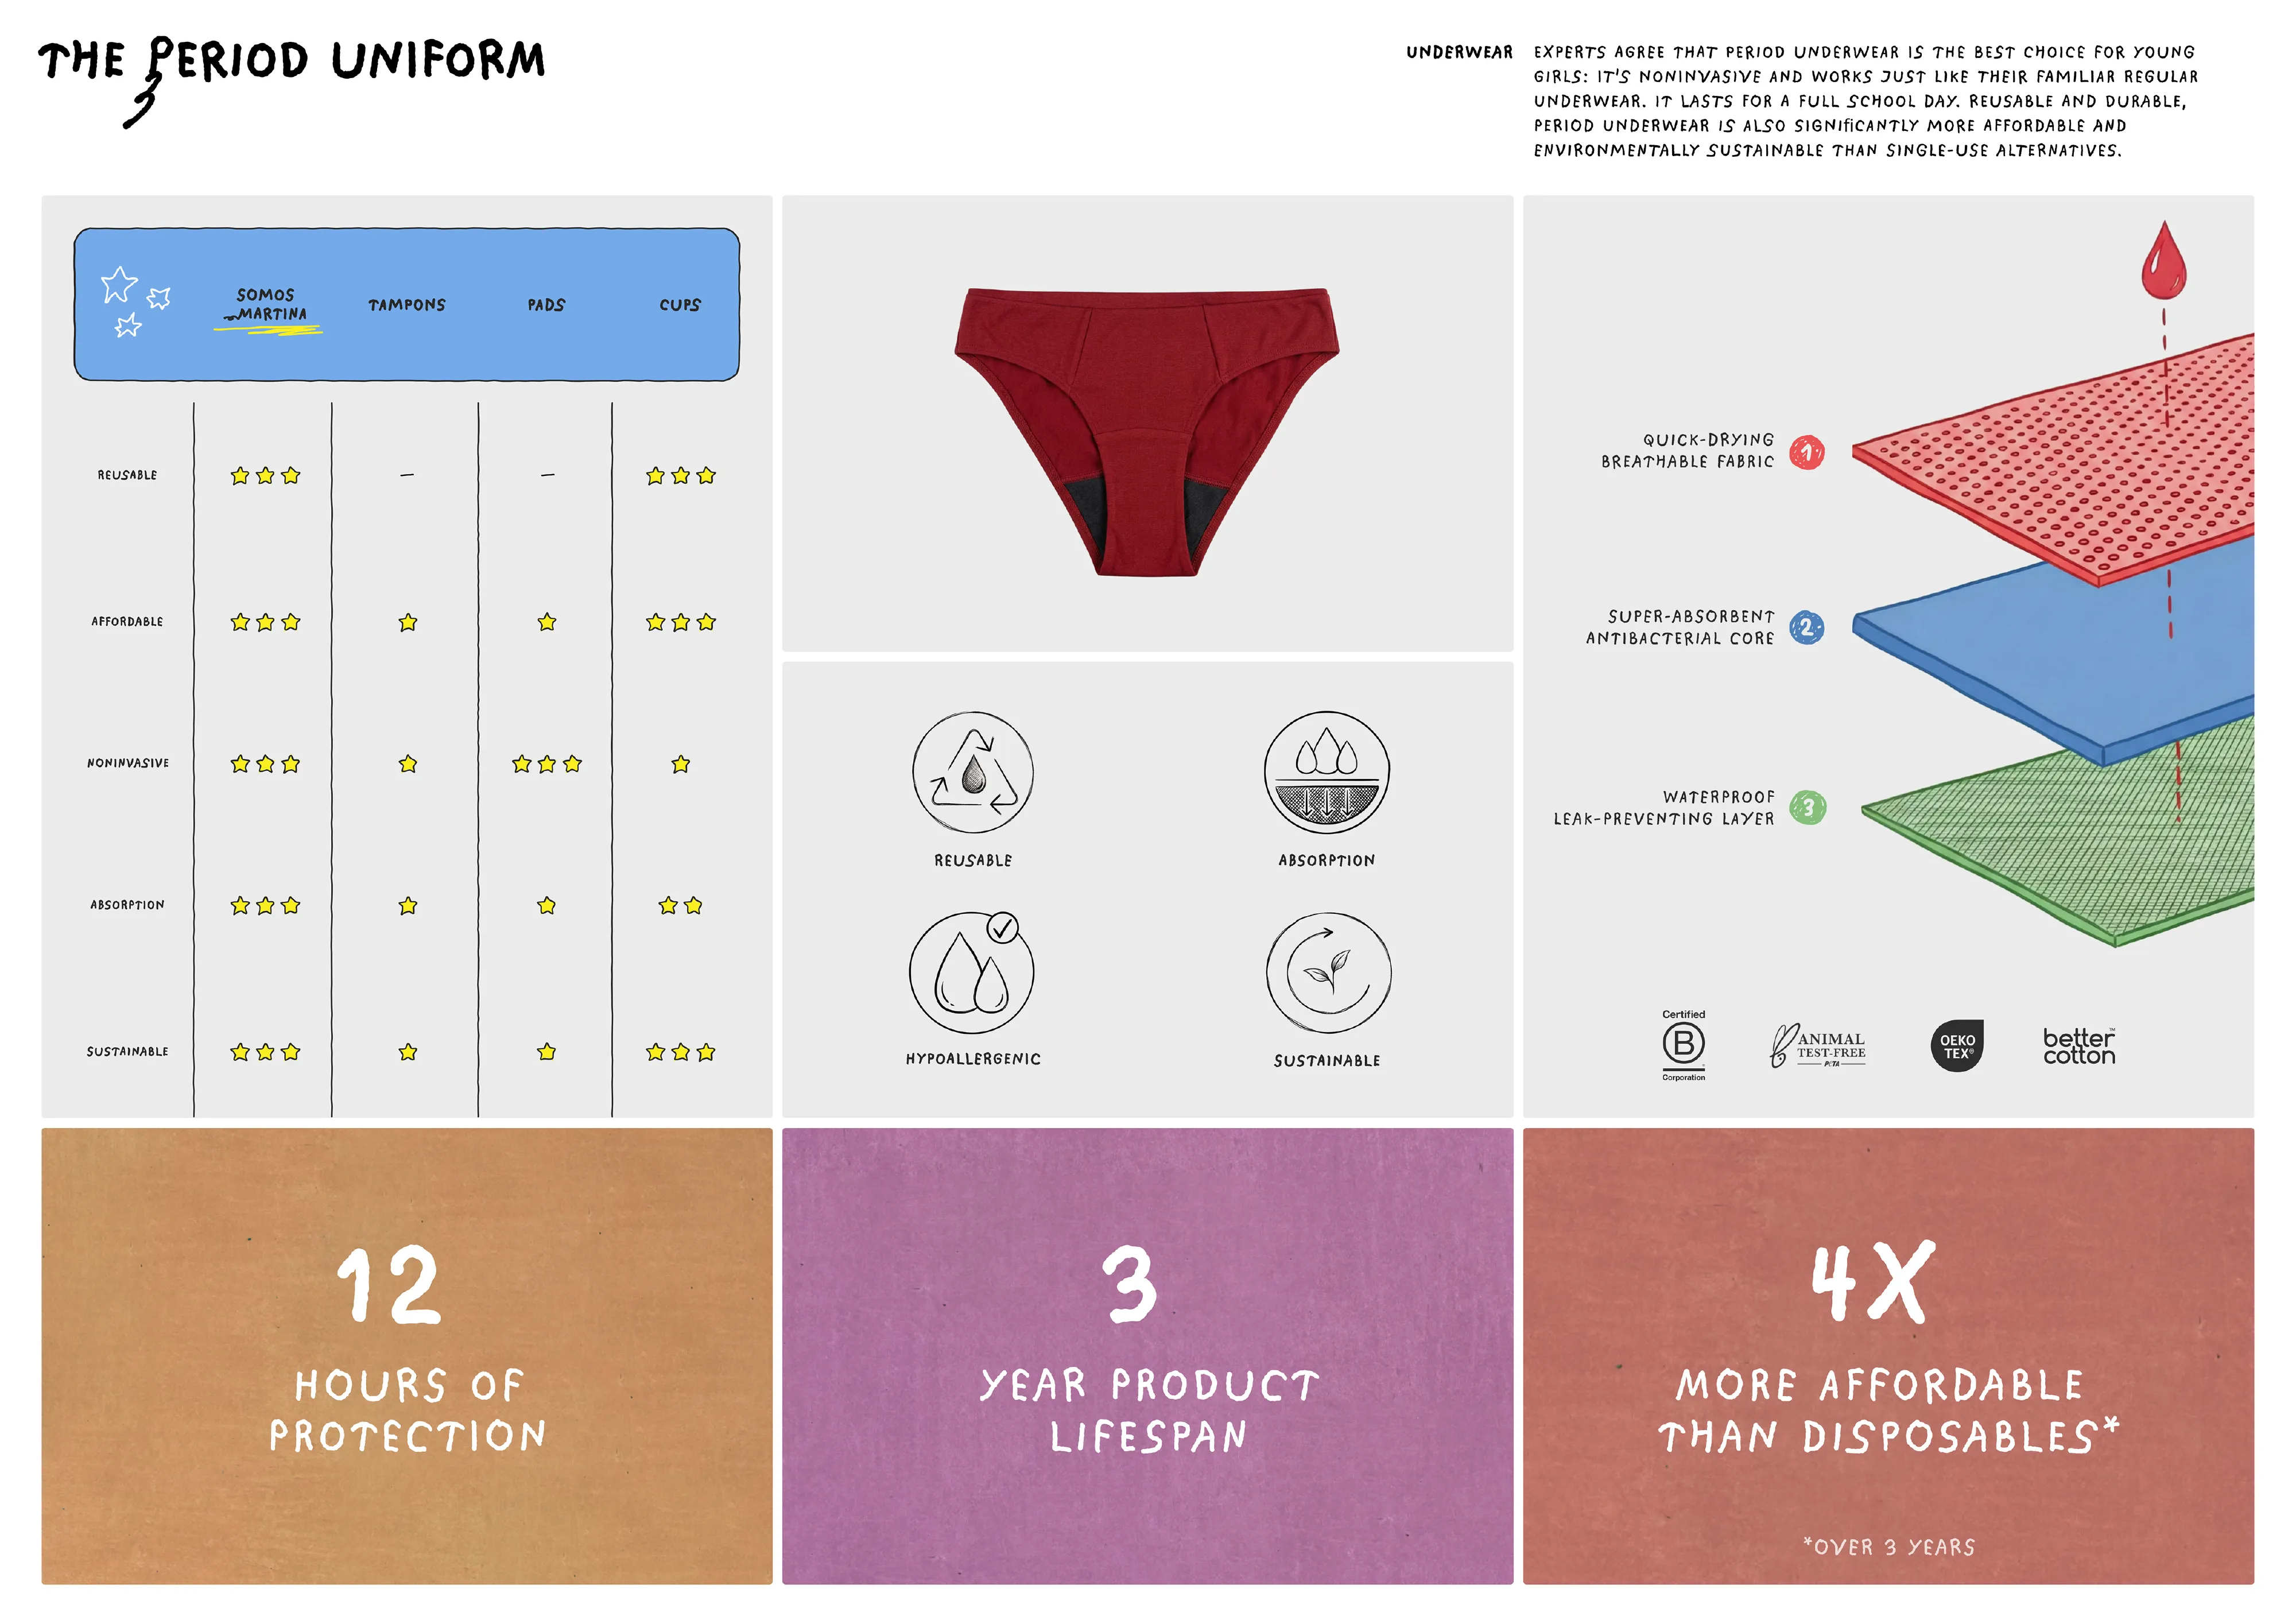
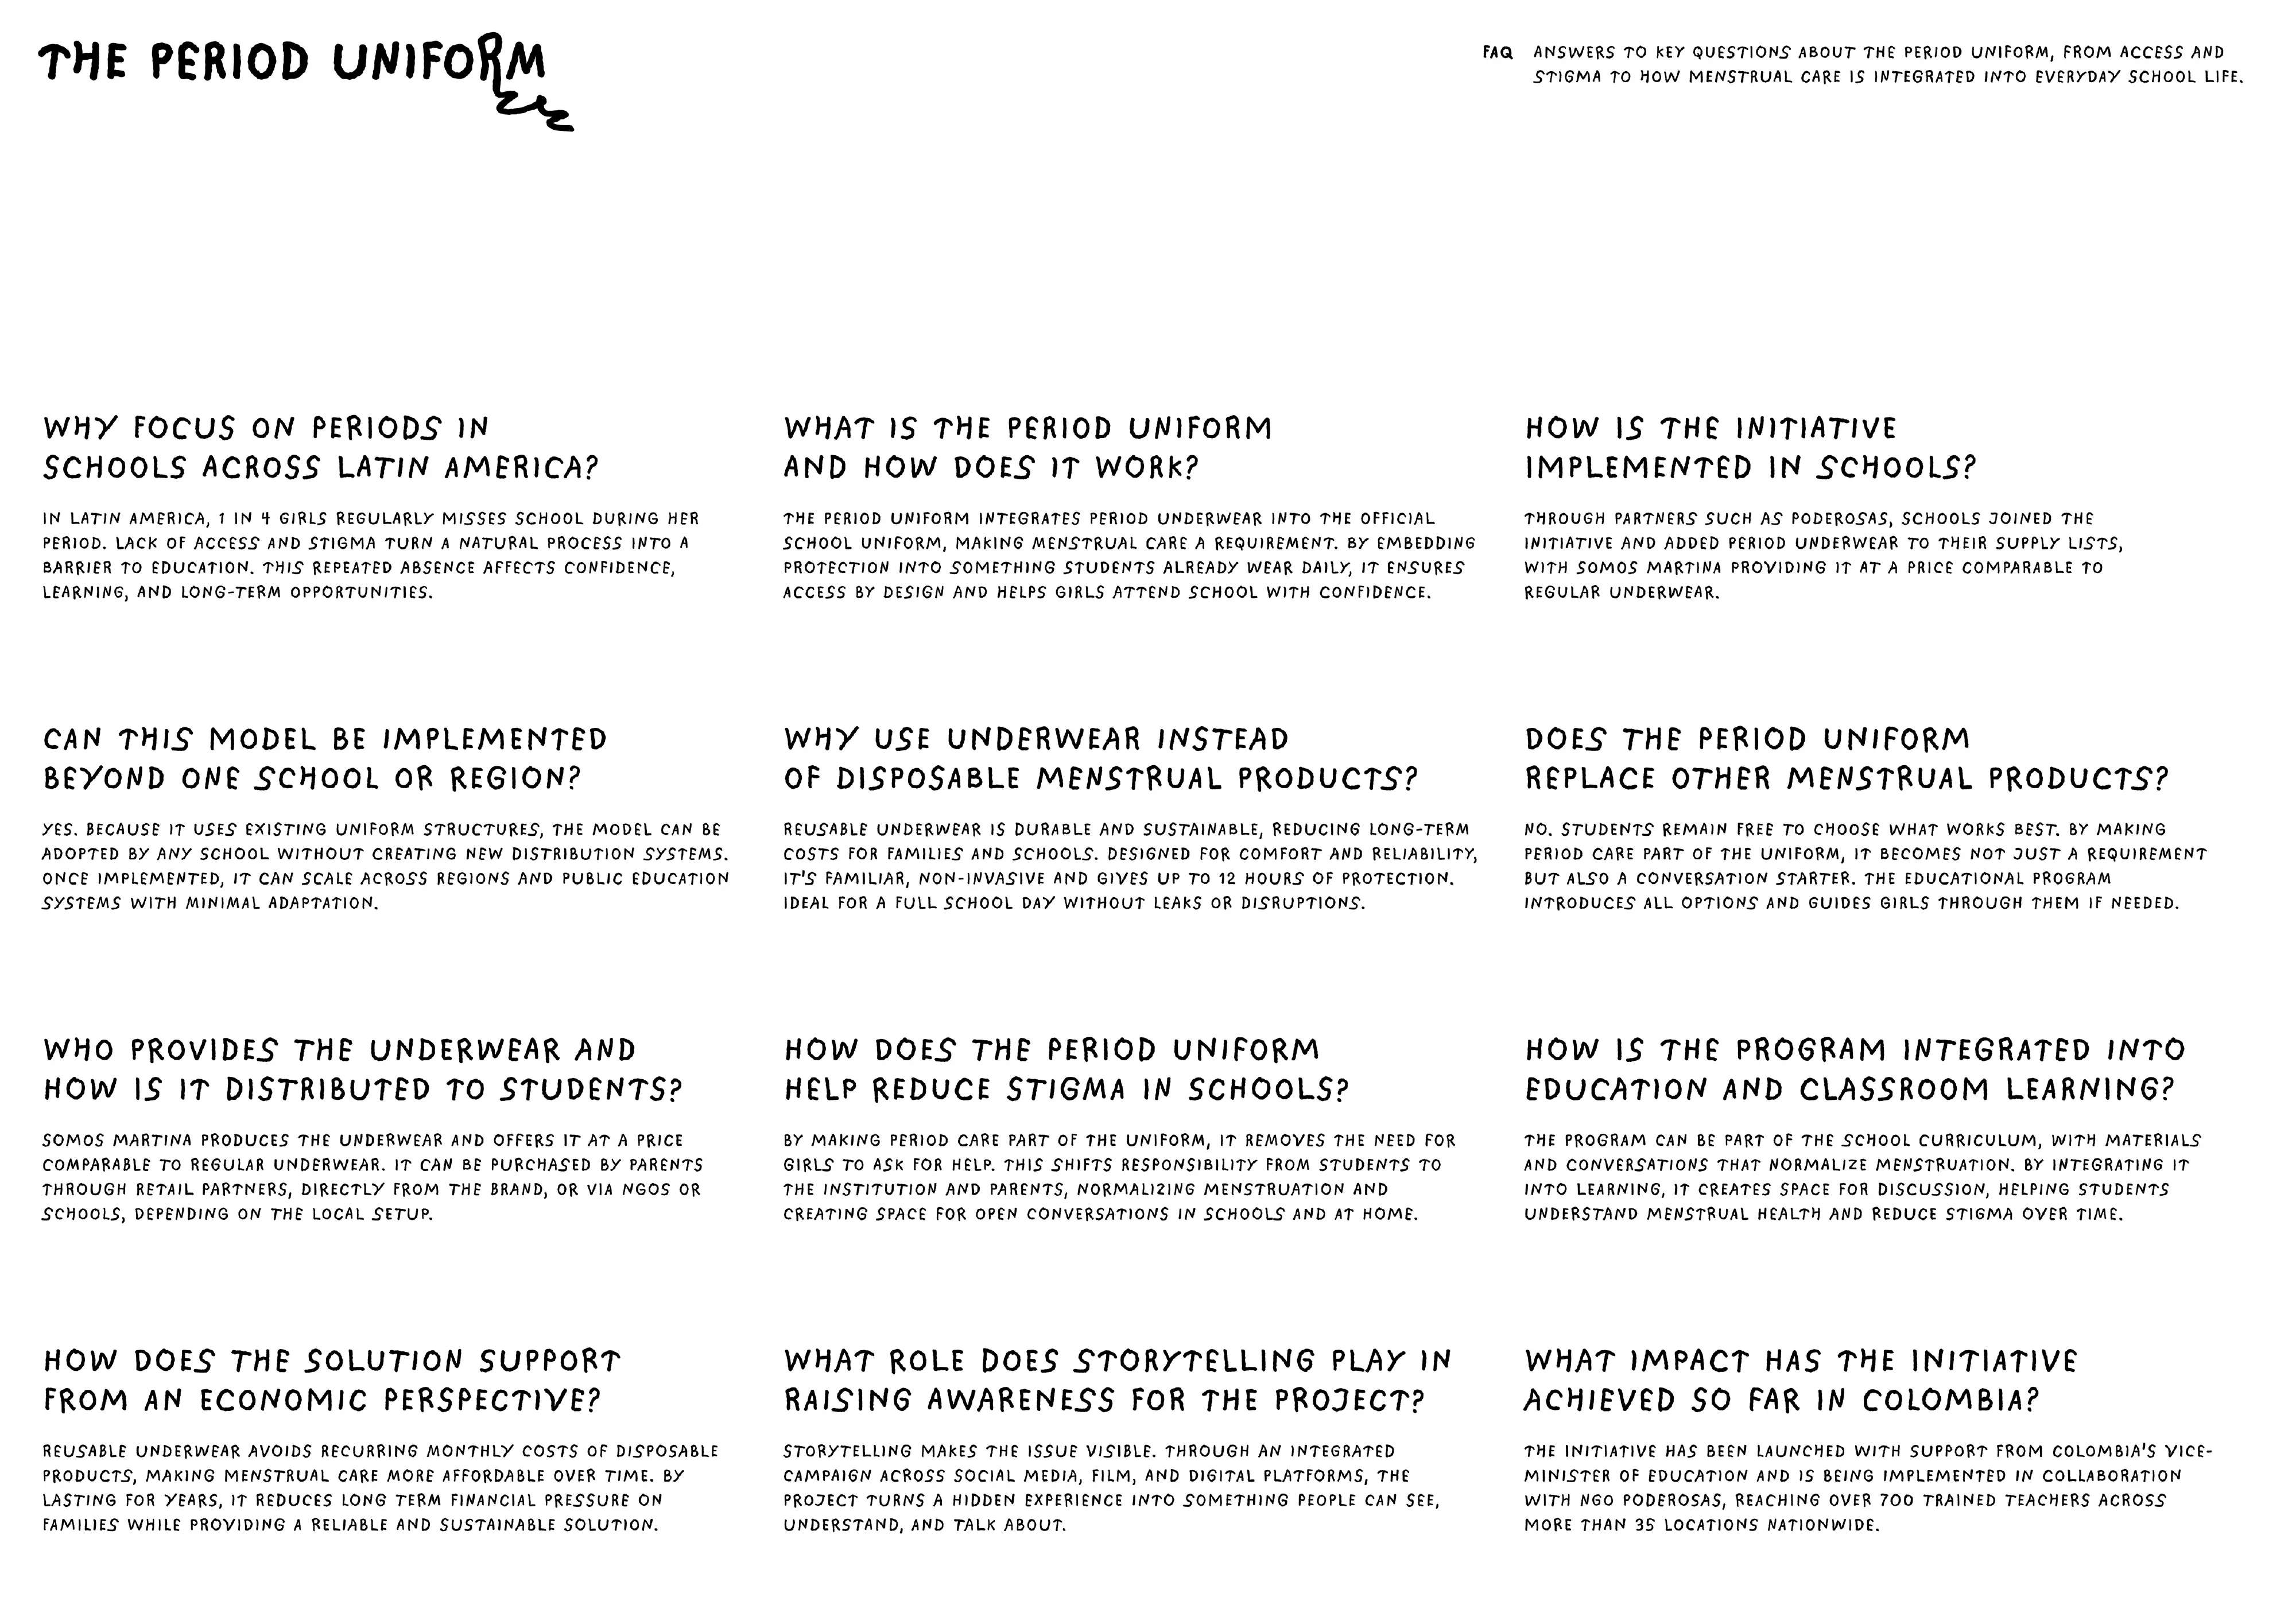
The Period Uniform is a landmark social initiative that integrates period protection directly into mandatory school uniforms. Created by Colombian B Corp Somos Martina in collaboration with Serviceplan Innovation, the project addresses the fact that 1 in 4 girls in Latin America regularly misses school during her period due to a lack of access to products and deep-rooted stigma. By making reusable period underwear an expected, everyday part of official schoolwear, the initiative turns menstrual care into standard educational infrastructure.
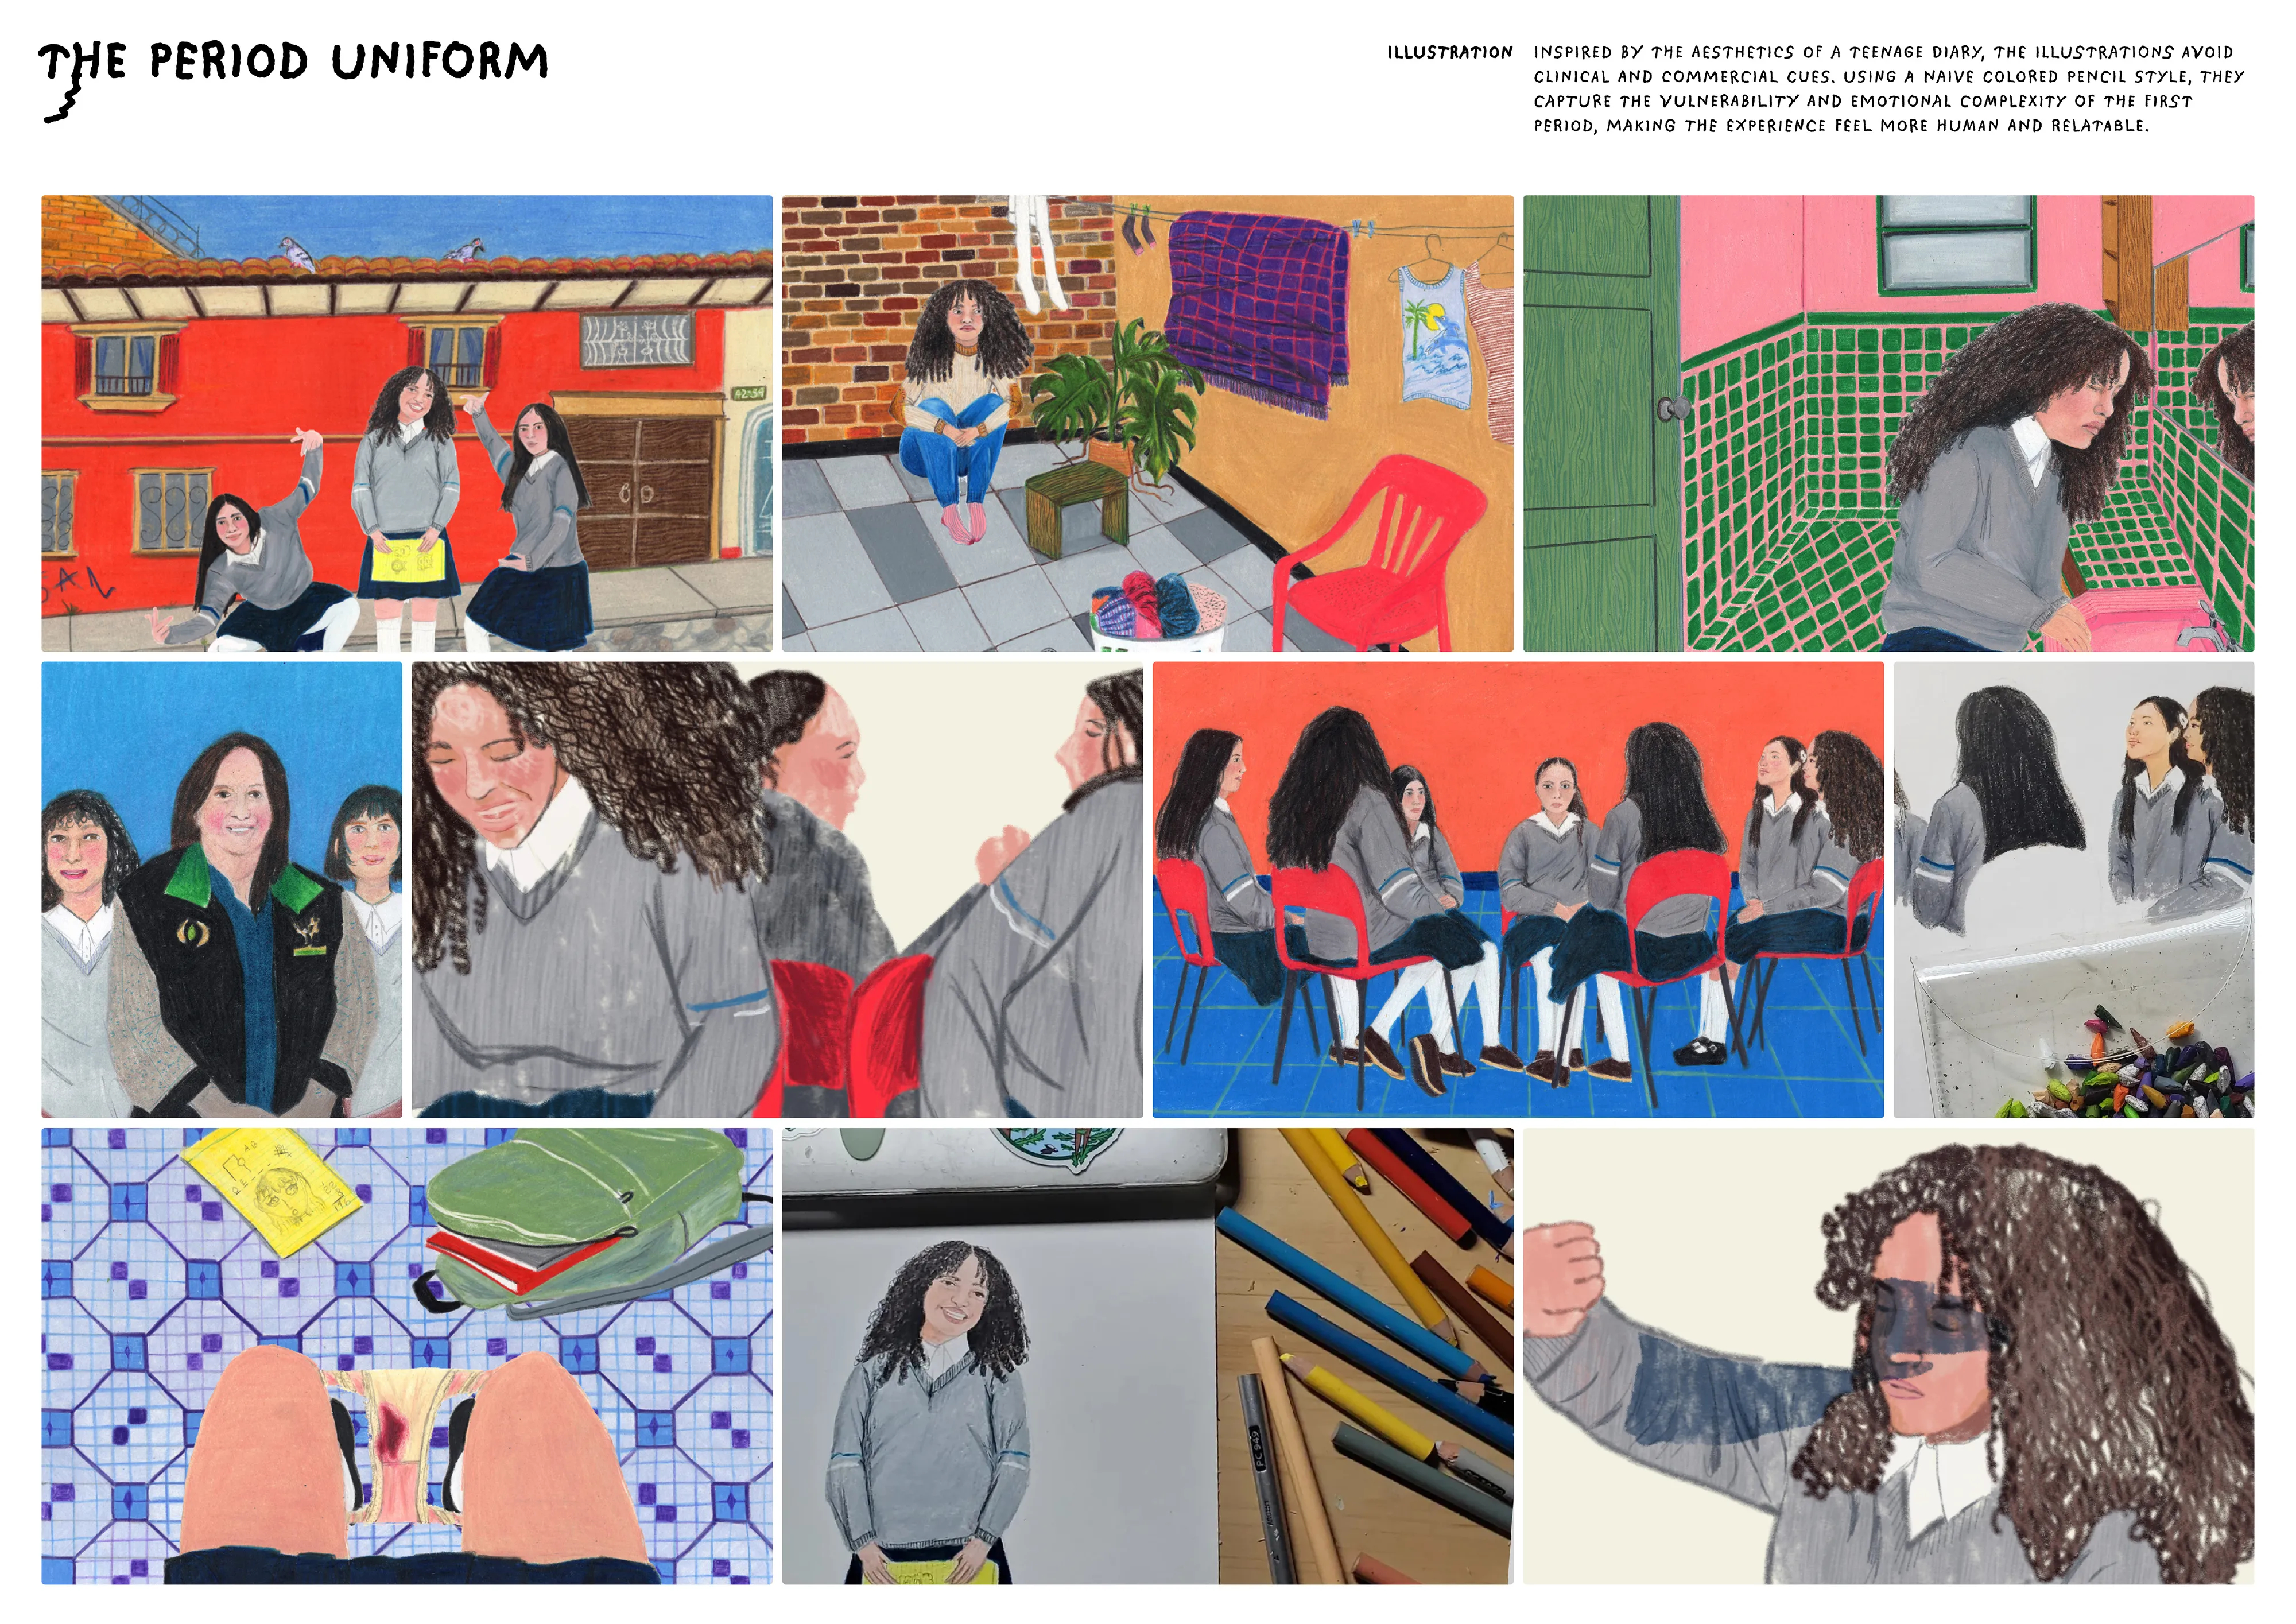
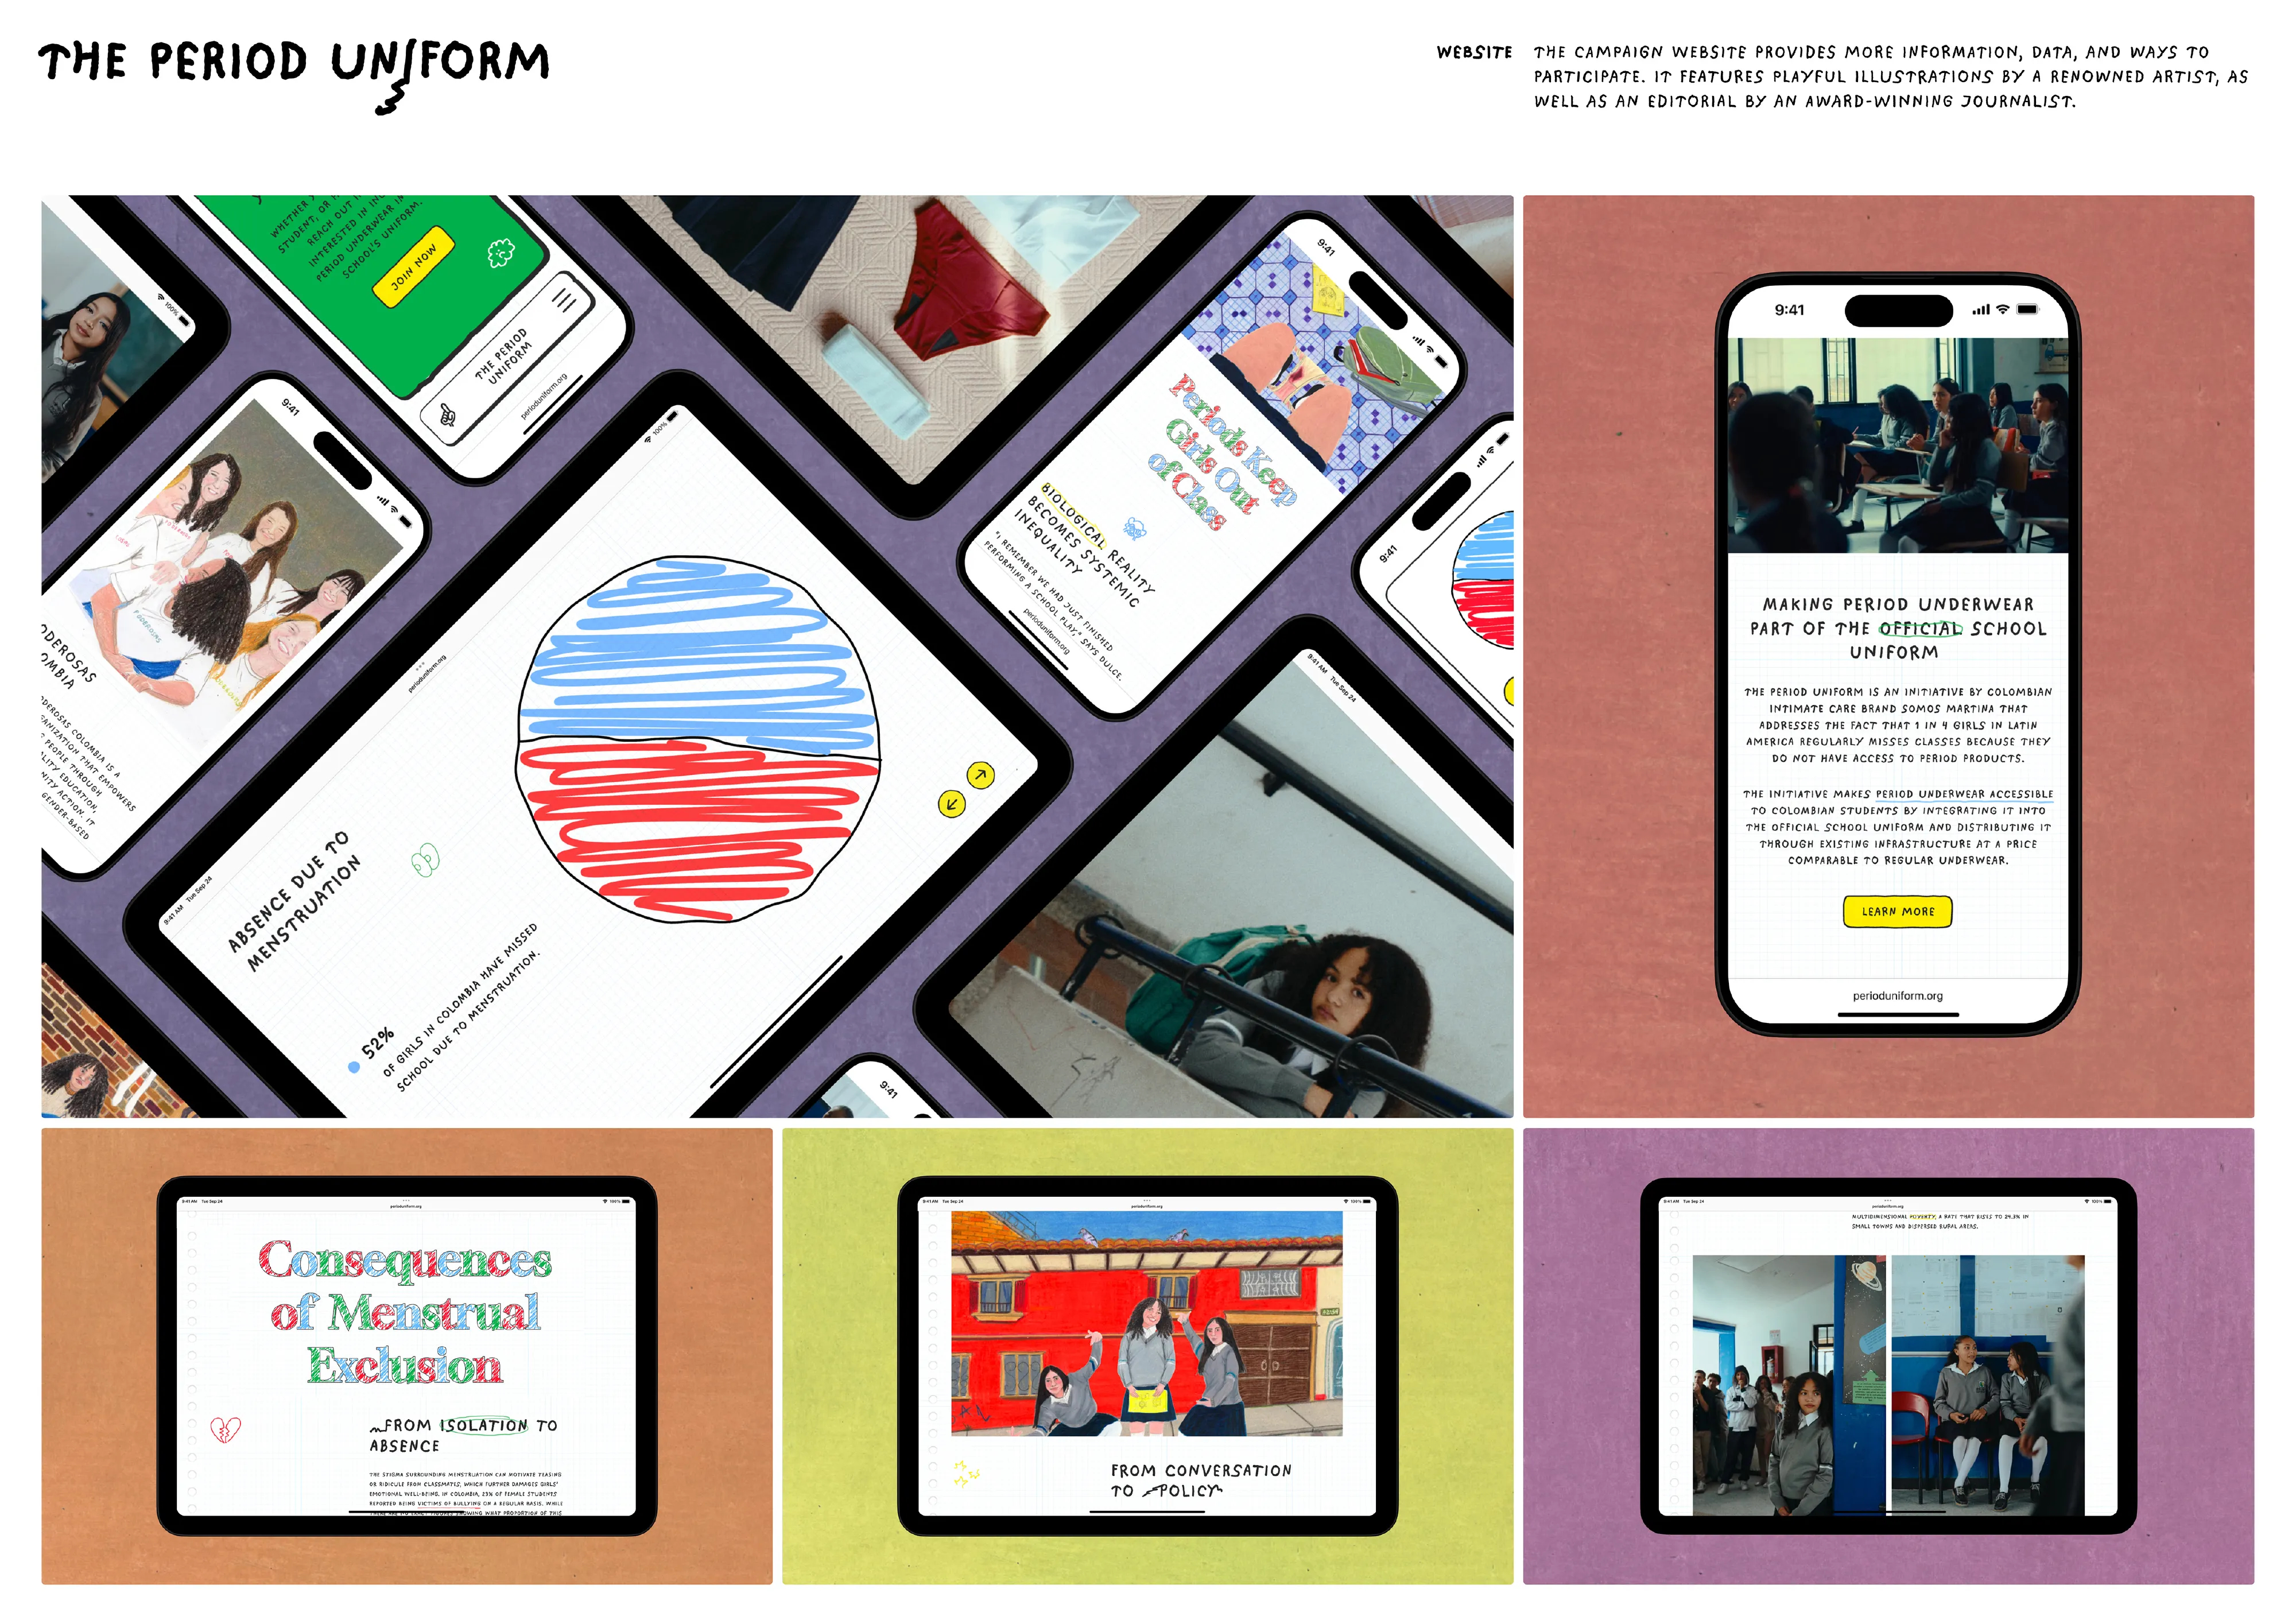
To communicate this systemic shift, the campaign required a digital platform that felt authentic, human, and deeply relatable to its teenage audience. The visual identity deliberately avoided clinical or commercial codes, opting instead for the intimate, hand-drawn aesthetic of a teenager's diary. This included colored-pencil illustrations, scribbled charts, and a bespoke handwritten typeface. To bring this concept to life online, STD.DEV was brought in to engineer the bilingual campaign websites and architect the interactive data components.
The Engineering Approach
The campaign’s visual style developed iteratively over time, driven by an exploration of what was technically viable on the web. While the design team initially aimed for a dynamic, "living" website with continuous hand-drawn elements, the concrete execution was defined together by testing performance limits and figuring out the asset pipeline. Instead of treating mobile performance constraints as an afterthought, we collaborated from the start to build an efficient data-exchange system. The goal was to let designers retain complete control over variable animation frames, colors, and chart legends within their native workspaces, while delegating the extraction and rendering logic entirely to the frontend.
The Solution
Rather than relying on heavy third-party animation libraries or Lottie exports, STD.DEV engineered a custom parsing pipeline to deliver a beautifully crafted, unified solution. Through tight collaboration, a workflow was established where designers embedded structural metadata directly into Adobe Illustrator files using named placeholder elements within specific sublayers. On load, a custom SVG parser extracted these properties and integrated the graphics natively into the DOM rather than treating them as isolated external assets. This allowed the exact same data structure to power the wiggling icons, animated section headers, and interactive charts with zero code redundancy. This native integration provided complete programmatic control over line thickness, dynamic colors, and path-drawing animations using highly optimized CSS. Additionally, STD.DEV built custom Drupal modules extending CKEditor, allowing editors to seamlessly highlight inline text using this exact same unified architecture.
Impact
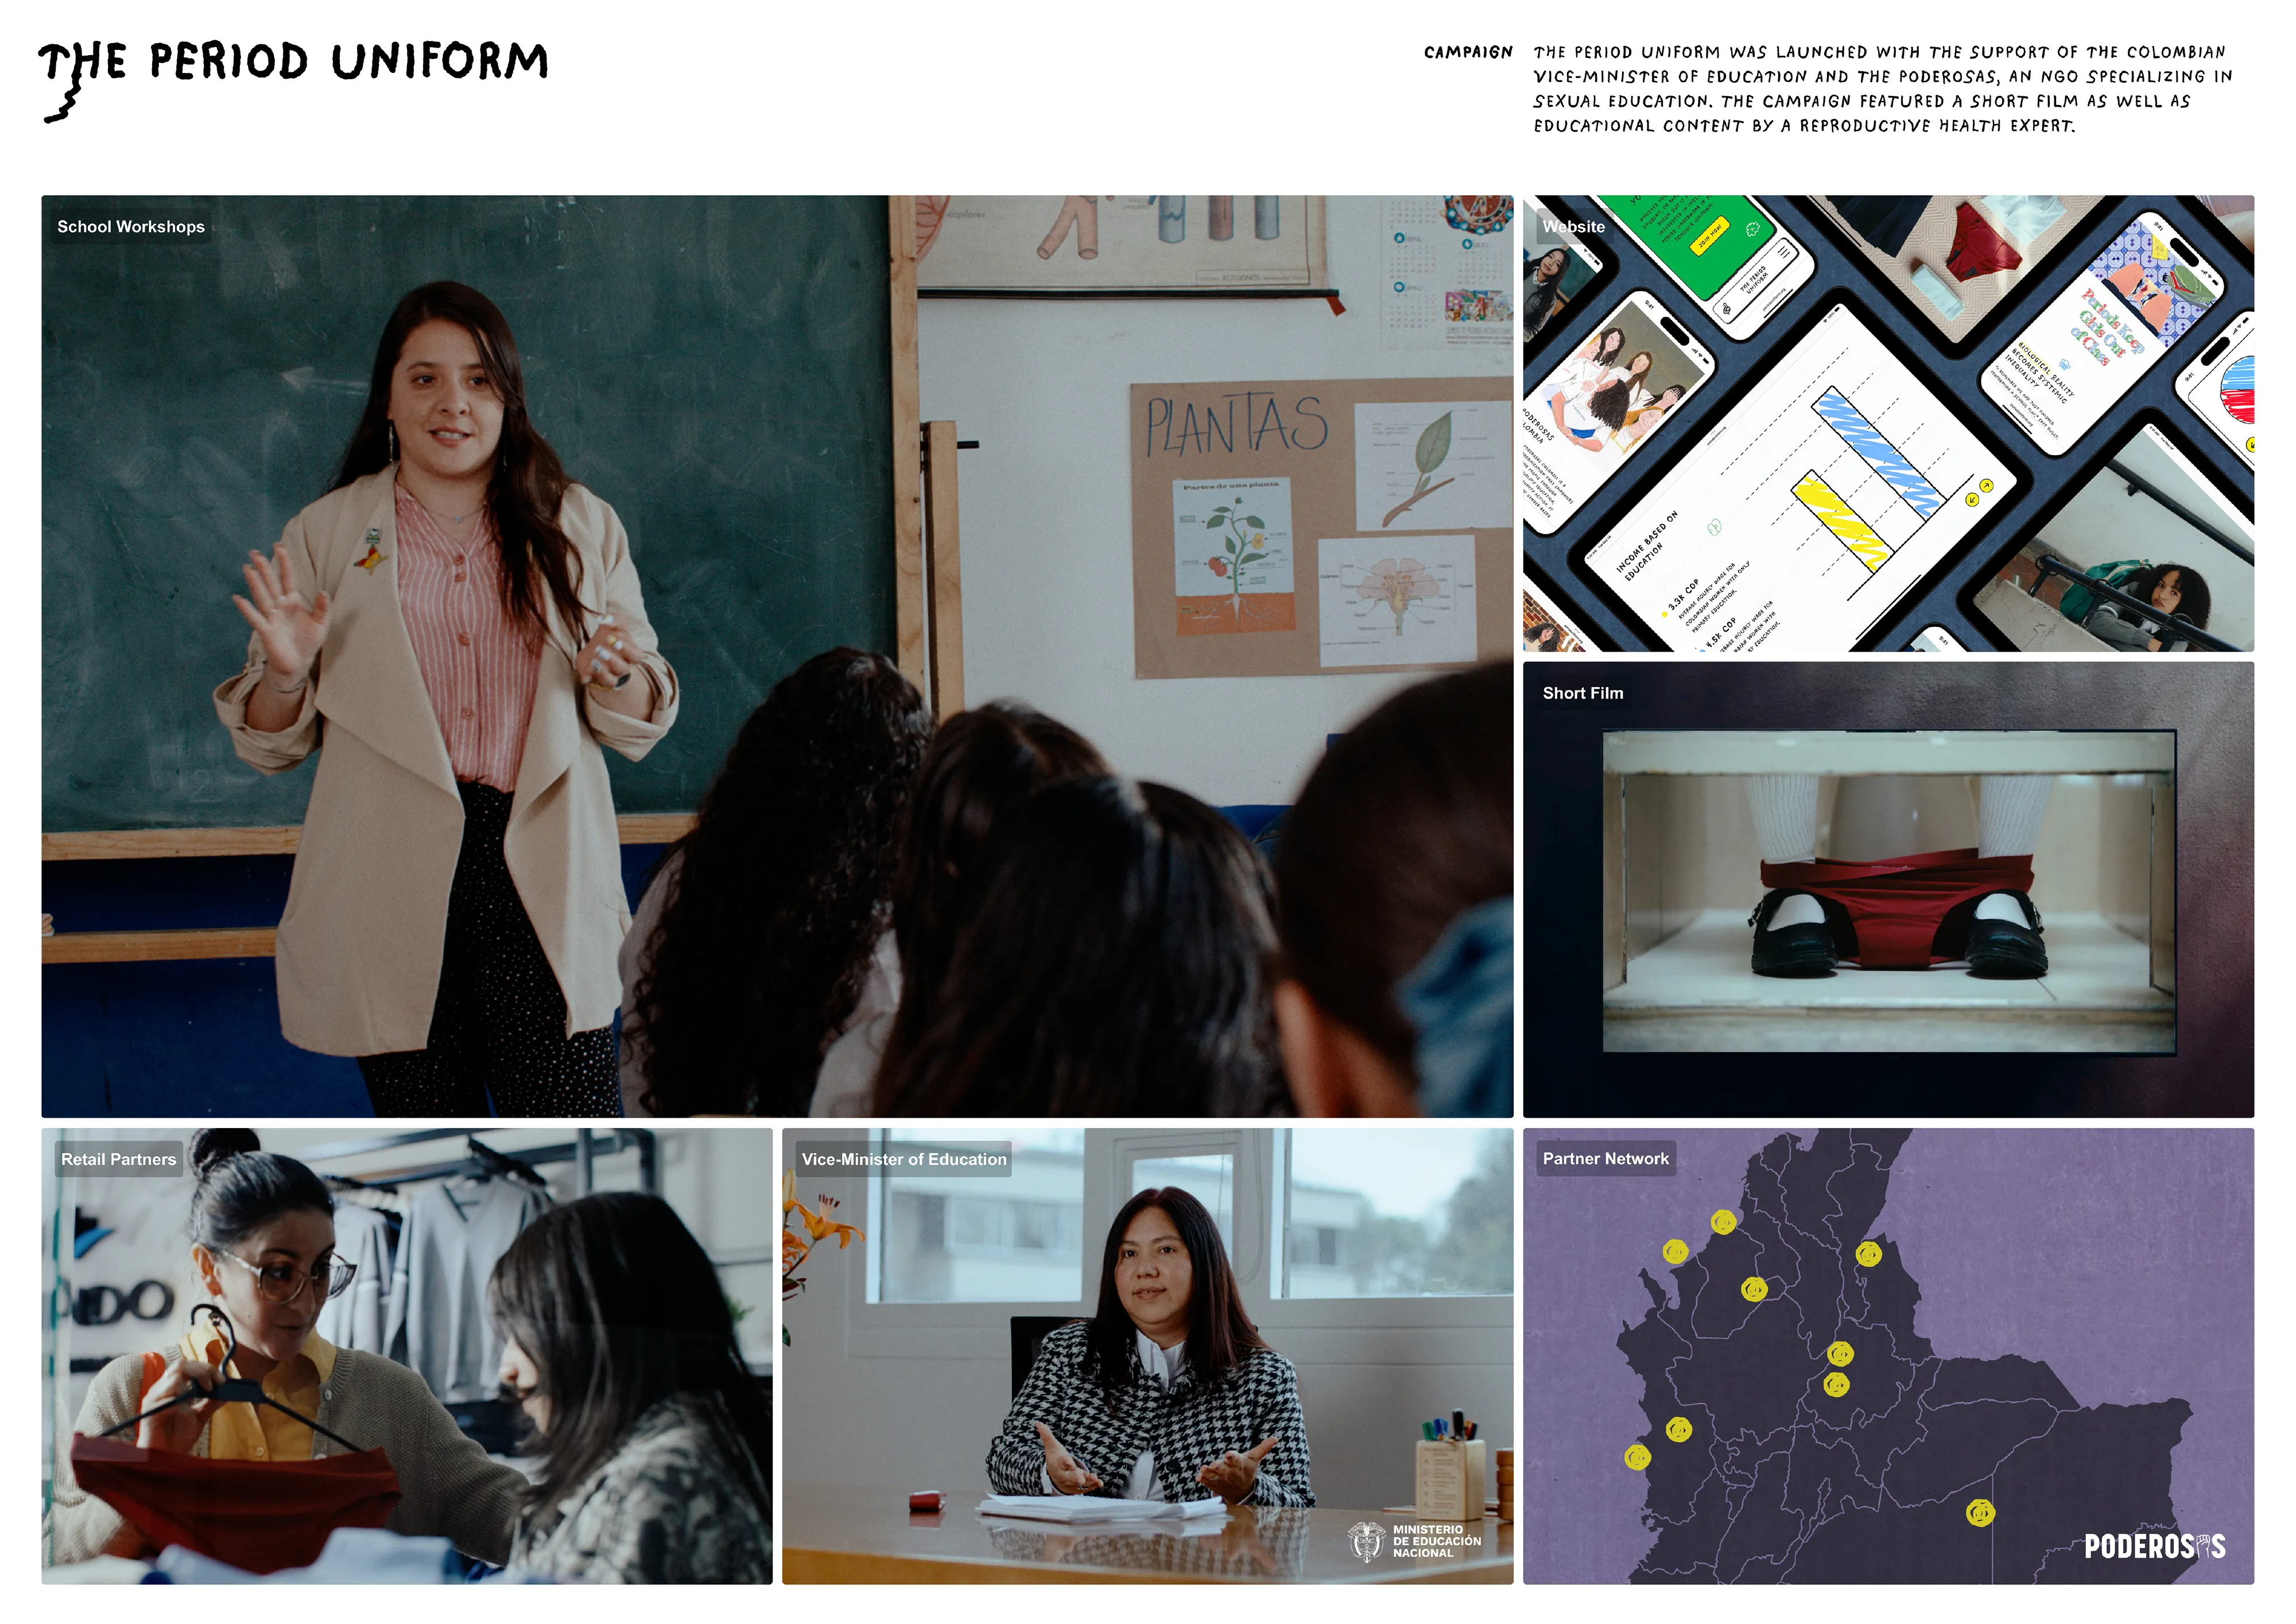
The Period Uniform initiative successfully helped shift the conversation around period poverty in Colombia from temporary aid to systemic policy, earning official backing from the Vice Minister of Education during its pilot phase. STD.DEV ensured the bilingual campaign website provided a stable, accessible global platform to share this mission. The resulting infrastructure delivered an intimate, diary-like digital experience that perfectly mirrored the empathy of the initiative, allowing the core message to resonate authentically with its teenage audience without technical friction.
Translating a delicate, hand-drawn aesthetic into a global platform relies on an integrated asset workflow and tailored backend integration. STD.DEV delivered this digital infrastructure across two key deliverables:
1. Campaign Website & Editorial Tooling
Developing the bilingual (EN/ES) campaign platform fueled by a shared frontend architecture. Custom modules were written to handle line animations for typography, native layout styling, and an interactive tracking cursor that preserves the sketchpad layout. For content operations, custom Drupal integrations extended CKEditor, allowing the client's editorial staff to apply native text-highlighting loops directly within the body field.
2. Data Visualizations
Rendering UNICEF and UNFPA absenteeism data using the exact same programmatic SVG parser built for the site's layout assets. By using vector paths embedded with localized design values directly from Illustrator, the web platform scales and redraws interactive charts dynamically on the frontend, avoiding isolated scripts or video playback overhead.
The Period Uniform proves that technical execution can deeply enhance emotional storytelling. By engineering highly performant animations and custom editorial tools, STD.DEV provided the digital canvas necessary to elevate a crucial social initiative into an immersive, relatable experience.
Credits
Client
Somos Martina
Advertising Agency & Creative Direction
Serviceplan Group / Serviceplan Innovation
Web Platform, SVG Animation & CMS Engineering
STD.DEV (Daniel Kuhnlein)
Film Director
Claudia Barral Magaz
Typography & Illustration
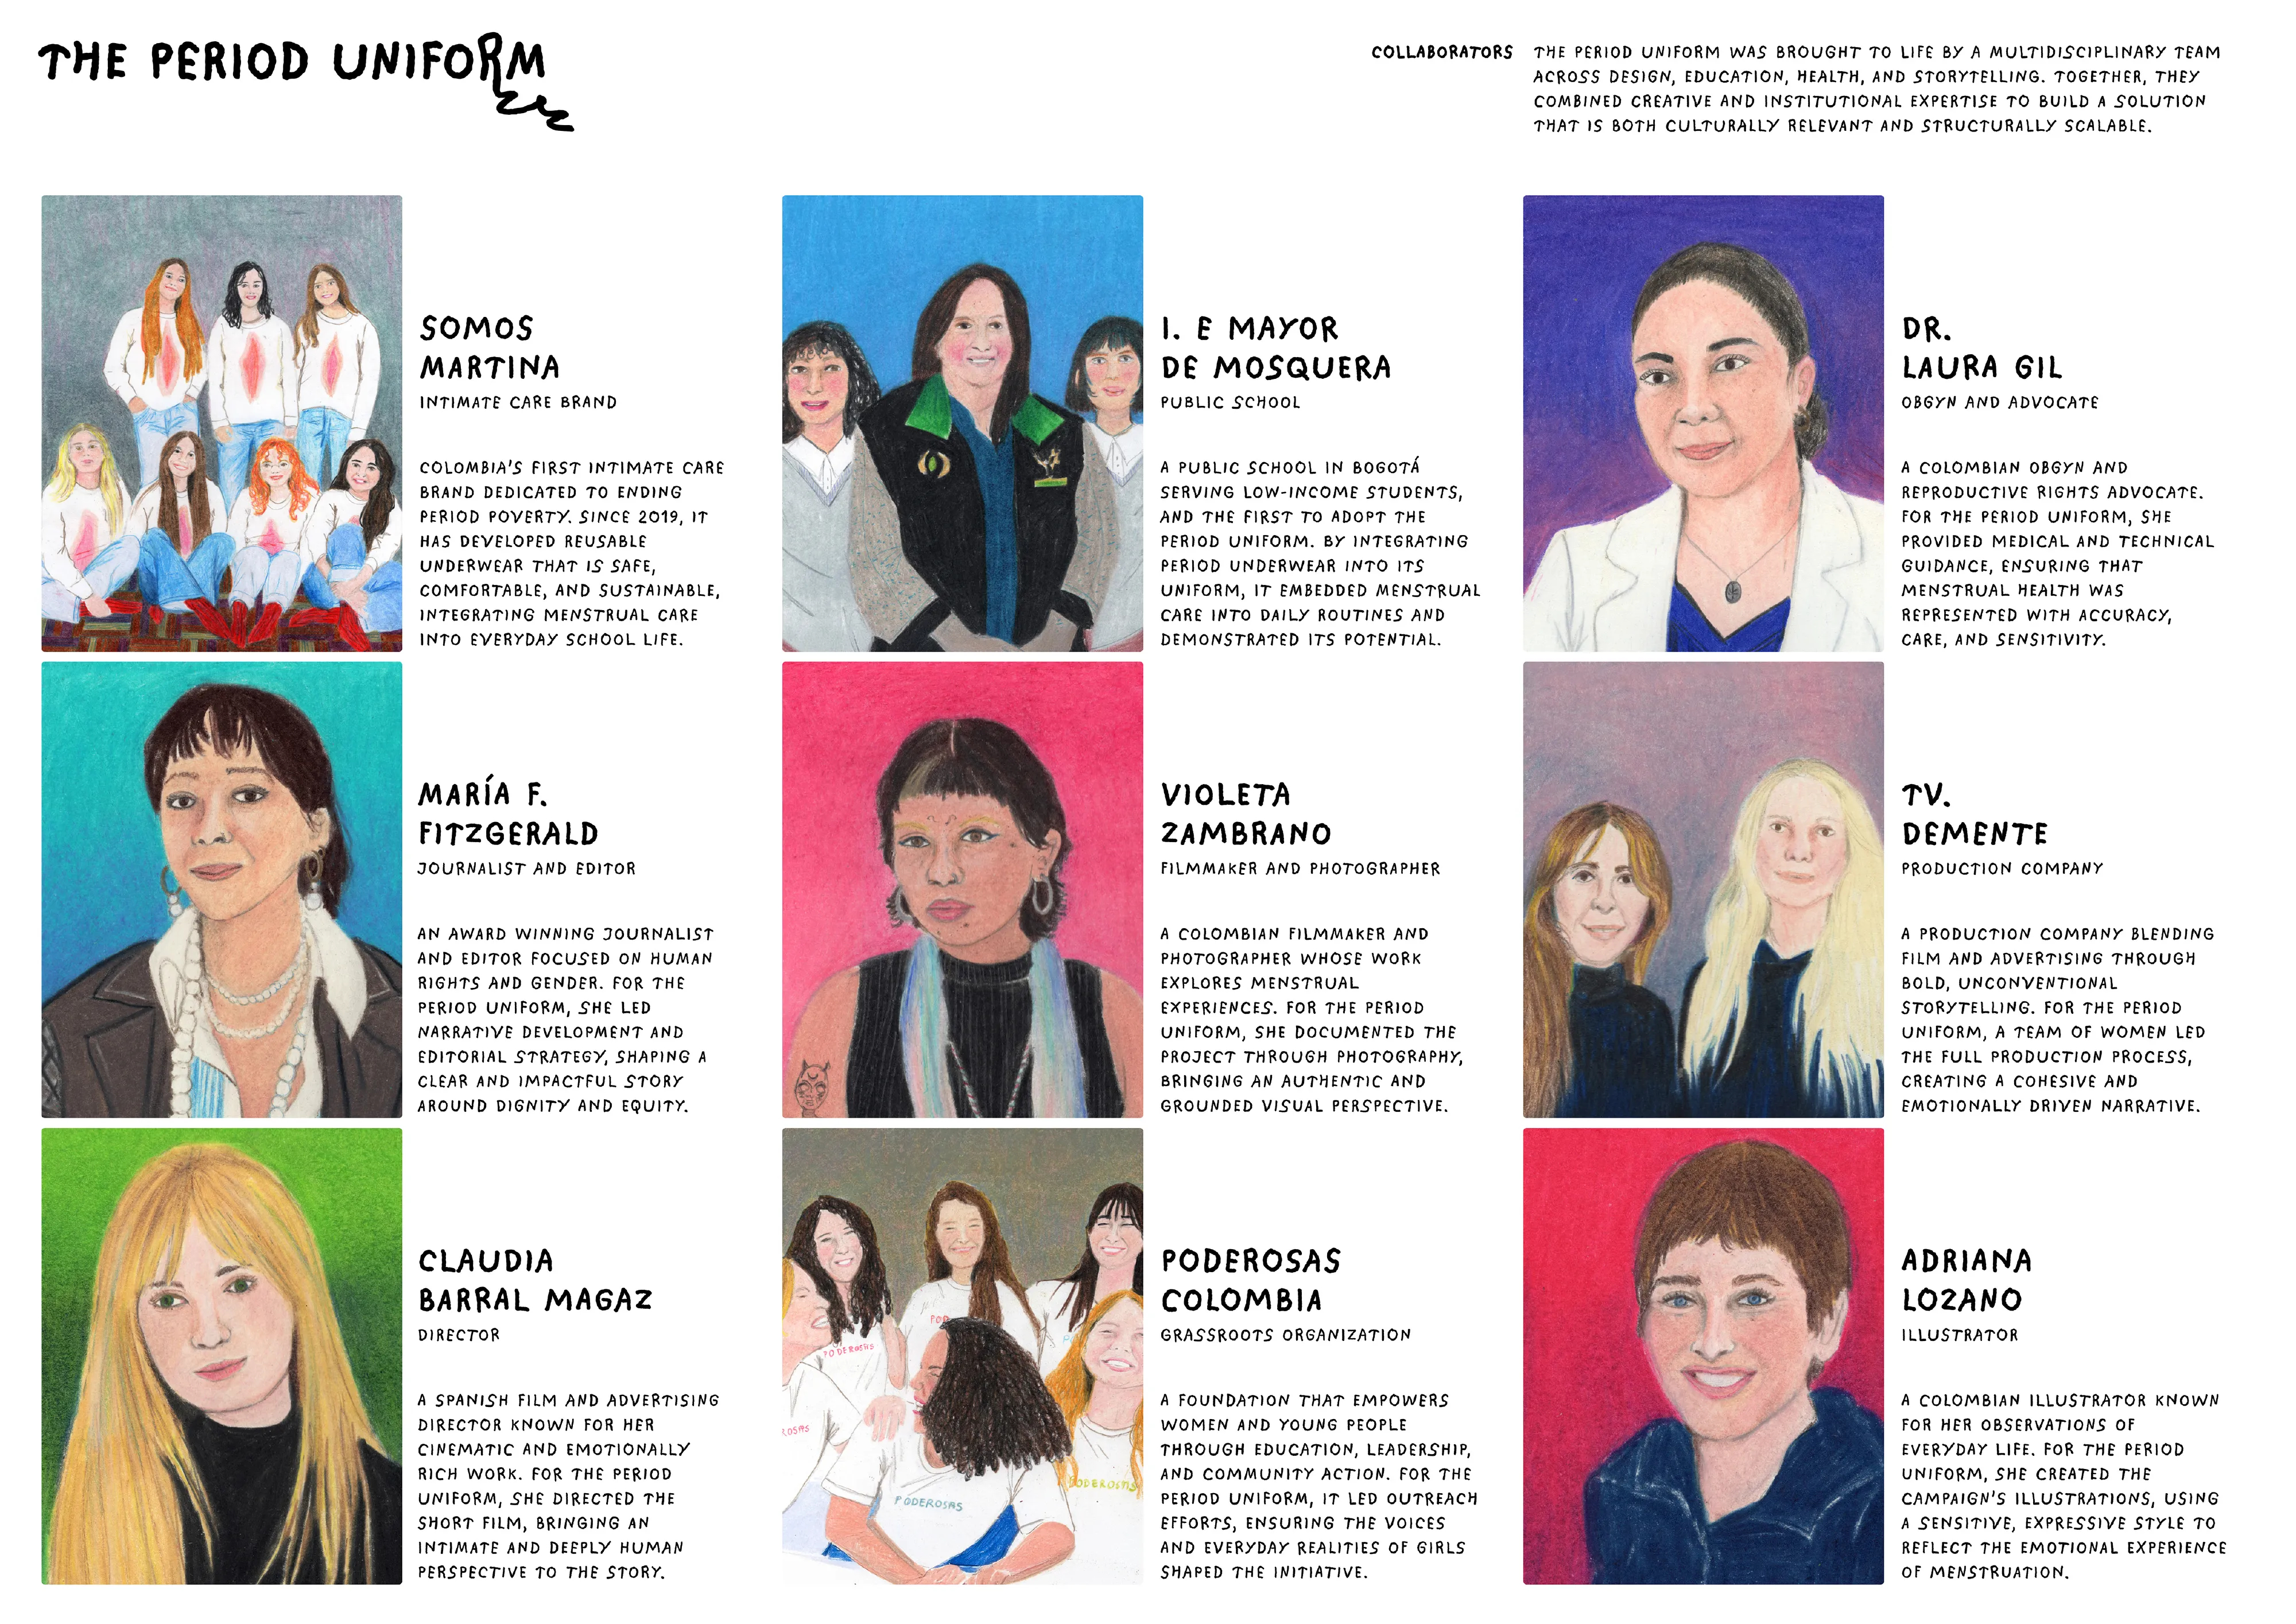
Stefan Marx, ABC Dinamo, Adriana Lozano
How did the Period Uniform initiative address period poverty in Latin America?
The Period Uniform initiative integrated reusable period underwear into mandatory school uniforms to provide consistent access to menstrual products and combat stigma, addressing the issue of girls missing school due to lack of supplies.
What was the design philosophy behind the campaign's digital platform?
How did STD.DEV engineer the interactive data components for the campaign website?
What was the strategic goal of the Period Uniform initiative beyond providing products?
Why did STD.DEV choose a custom SVG parser instead of standard animation libraries?
How did the editorial team integrate the campaign's visual style into content?
What was the business impact of the Period Uniform initiative?
How did the team ensure mobile performance was considered during development?
What was the rationale for the hand-drawn aesthetic in the campaign's visual identity?
How did the website render interactive charts and data visualizations?